AP English Language study guide · Chapter 23
Say only what the graph can support
CHAPTER 22
Say only what the graph can support
Visual sources invite overstatement because the display can look more decisive than the data are. Read the labels and units before writing a claim, then check which population and time period the figure actually covers. Use only the conclusion the display supports.
Read the variable before reading the trend
Before interpreting what a chart shows changing, identify exactly what is being measured. A chart's trend line means nothing until you know precisely what variable that line represents, and confusing a related variable for the one actually shown produces a claim the chart does not support.
Check the units before comparing values
Two numbers cannot be meaningfully compared unless they share the same units. A count of patrons is not the same kind of value as a percentage of patrons, and treating them as interchangeable produces a comparison the data does not actually make.
Find the population the data actually represent
A chart's population, who or what was actually measured, limits how broadly its findings can be applied. Data drawn from one county cannot be presented as describing an entire state or country without additional support.
Keep the time window inside the claim
A chart's data was collected during a specific time window, and any claim built from it should stay inside that window unless another source establishes that the pattern continued. A single year's data does not, by itself, establish a long-term trend.
Separate count from rate
A raw count, how many, and a rate, what proportion, answer different questions and can even point in different directions. A group can have a high count of late returns simply because it is a large group, while having a low rate of late returns relative to its size. Confusing the two produces a misleading claim.
Refuse to turn correlation into cause
A chart showing that two variables move together, income bracket and late-return rates, for instance, does not by itself establish that one causes the other. Other explanations, access to transportation, work schedules, or distance from a branch, could also explain a correlation the chart shows without confirming a causal claim the chart itself never makes.
Read the display type before interpreting it
For a graph, read the axis labels and scale. For a table, identify the row and column units and the denominator behind any rate. For a map, read the legend and geographic unit. Then state only the relationship the display actually shows.
Connect the visual to another source only when the evidence permits it
Combining a visual source's finding with a claim from a different source can strengthen an essay, but only when the two sources actually address the same specific population, variable, and time period closely enough to be connected without overstating either one.
|
EXAM DIAMOND State the smallest accurate claim a visual source supports: the exact variable, in its actual units, for its specific population and time window. A dramatic overstatement is weaker than a precise limitation. |
VISUAL SOURCE FOR THIS CHAPTER
This new source supplements the library late fees packet from Chapter 19. Read the graph carefully before answering the chapter's questions.
Source G
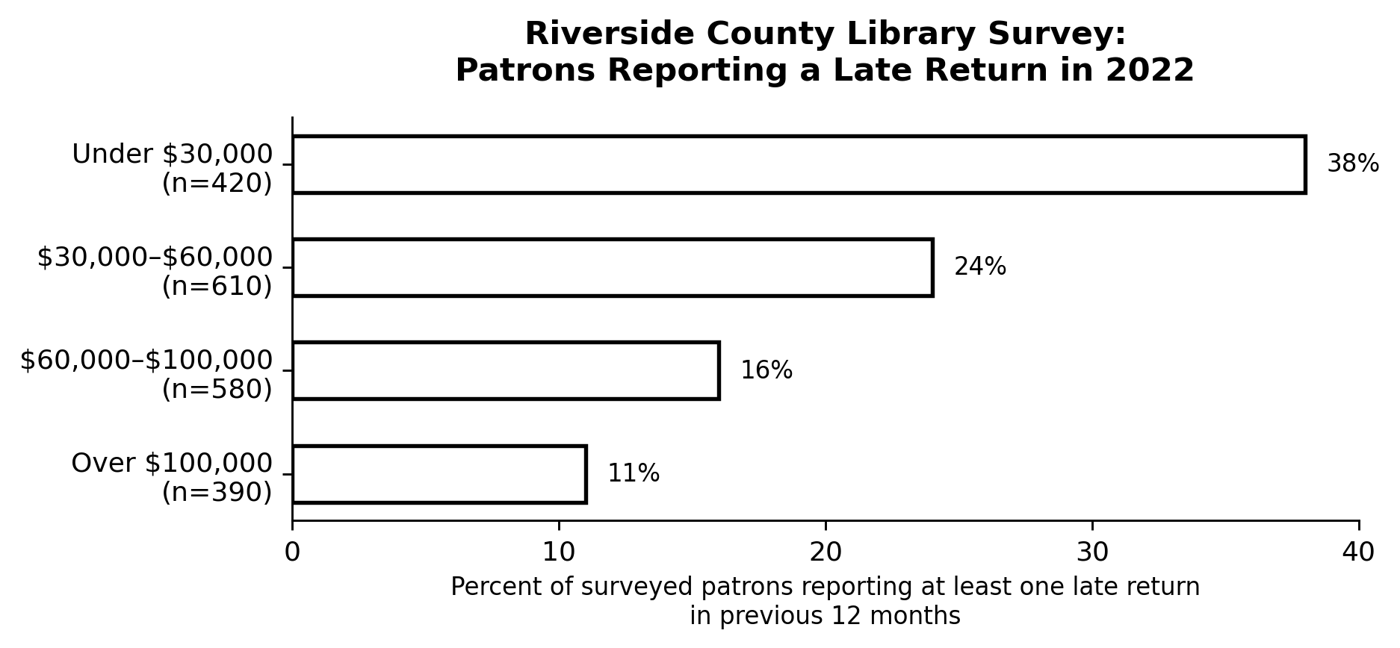
Source G: Simulated survey data for instructional use; percentages rounded to the nearest whole percent.
CONSTRUCTED-RESPONSE DRILLS
These drills use Source G above.
Drill 1: State the smallest accurate claim
Using Source G, state the smallest accurate claim the data support about the relationship between income bracket and late returns, being careful about population, time window, and causation.
Model reasoning: Among Riverside County library patrons surveyed in 2022, prior to fee elimination, a higher percentage of patrons in lower income brackets reported late returns than patrons in higher income brackets. This claim stays inside the survey's specific population and time window and describes a correlation without asserting that income level directly causes late returns, since the data do not establish a causal mechanism.
Drill 2: Separate count from rate
A student claims: “More patrons in the $30,000–$60,000 bracket returned items late than in any other bracket, since that group had the highest number of patrons surveyed.” Explain the count-versus-rate error in this claim.
Model reasoning: The claim is unsupported because sample size and late-return rate must be combined. Approximate counts are 420 × .38 ≈ 160 late-returning patrons in the under-$30,000 group and 610 × .24 ≈ 146 in the $30,000–$60,000 group. The larger sample therefore did not produce the larger estimated count. Because the displayed percentages may be rounded, describe these as approximate counts.
CHAPTER 22 PRACTICE
These questions use Source G above. Answer all eight questions before checking explanations.
Question 1
- A. The number of patrons surveyed in that income bracket
- B. The average number of days an item was overdue
- C. The percentage of surveyed patrons in that income bracket who reported at least one late return in the previous 12 months
- D. The total fines collected from that bracket
Question 2
- A. Comparing the percentage reporting late returns across all four income brackets
- B. Comparing the number of patrons surveyed in the under-$30,000 bracket, 420, directly to the percentage reporting late returns in the over-$100,000 bracket, 11%
- C. Comparing the bar lengths for the two lowest income brackets shown in the graph
- D. Comparing the number of patrons surveyed across all four income brackets
Question 3
- A. Library patrons nationwide show higher late-return rates in lower income brackets
- B. All households earning under $30,000 return library items late
- C. Every public library system shows this same income-based pattern
- D. Among the specific Riverside County patrons surveyed in this study, late-return rates were higher in lower income brackets
Question 4
- A. In the year surveyed, prior to fee elimination, late-return rates varied by income bracket among Riverside County patrons
- B. Late-return rates will always vary by income bracket in Riverside County
- C. Late-return rates have varied by income bracket in Riverside County for decades
- D. Late-return rates varied by income bracket at some unspecified point in library history
Question 5
- A. This bracket had the most patrons of any group surveyed
- B. While this bracket had fewer total patrons surveyed than the $30,000–$60,000 bracket, it had the highest rate of reported late returns at 38 percent
- C. This bracket's rate and count are identical values expressed differently
- D. This bracket had the lowest rate of late returns among all four groups
Question 6
- A. Lower income directly causes patrons to return items late
- B. Higher income makes patrons more responsible library users
- C. The data show a correlation between income bracket and late-return rates, though the table alone does not establish what specifically causes this pattern
- D. Income bracket has no relationship to late returns at all
Question 7
- A. Source G and Source C were collected using the identical survey methodology and should be treated as a single combined dataset
- B. Source G and Source C are unrelated and should never appear in the same paragraph
- C. Source G proves that the parent described in Source C was surveyed as part of this study
- D. Source G's finding that lower-income patrons report higher late-return rates provides broader, quantitative context for the specific scheduling pressures Source C's parent describes
Question 8
- A. The data measure late-return rates, not reading habits or values, so any claim about how much a group values reading goes beyond what the graph actually displays
- B. The claim is an accurate summary of what the graph shows
- C. The claim correctly separates count from rate
- D. The claim appropriately limits itself to the data's actual population
ANSWERS AND EXPLANATIONS
Show the answers and explanations
1. Correct answer: C
A: The number of patrons surveyed is shown as a labeled sample size beside each bar, not represented by the bar's length itself.
B: No data about the length of overdue periods appears in this graph; the bar length measures a percentage of patrons, not days overdue.
C (correct): This precisely names what the bar length represents: a percentage, specifically of patrons reporting at least one late return, within a defined past-year time window.
D: This graph does not display fines at all; the bar length measures the percentage of patrons reporting late returns.
2. Correct answer: B
A: This comparison is valid because it compares the same unit, percentage, across all four brackets consistently.
B (correct): A raw count and a percentage are different kinds of values; comparing them directly, as though one number were simply larger or smaller than the other in a meaningful way, is not a valid comparison.
C: This comparison is valid because it compares the same unit, percentage, represented by bar length, across two brackets consistently.
D: This comparison is valid because it compares the same unit, a count of patrons, across all four brackets consistently.
3. Correct answer: D
A: This claim extends the finding to a national population that Source G, a single-county survey, does not represent or support.
B: This claim extends beyond the specific surveyed patrons to all households in this income bracket everywhere, which the data do not support.
C: This claim extends far beyond the single county surveyed to all public library systems, which this data cannot support.
D (correct): This claim correctly limits itself to the specific surveyed population, Riverside County patrons in this particular study, rather than extending the finding beyond what was actually measured.
4. Correct answer: A
A (correct): This claim correctly specifies the data's actual time window, the year surveyed prior to fee elimination, rather than implying the pattern is permanent or ongoing.
B: This claim extends the finding into an indefinite future the single-year data cannot establish; a pattern from one year does not confirm it will always hold.
C: This claim extends the finding backward across decades that this single-year survey does not cover or support.
D: This claim vaguely detaches the finding from its actual, specific time window rather than keeping the claim tied to the year the data were collected.
5. Correct answer: B
A: This is factually incorrect; the $30,000–$60,000 bracket had more patrons surveyed, 610, than the under-$30,000 bracket's 420.
B (correct): This statement correctly distinguishes the raw count of patrons surveyed, which was lower than the next bracket's, from the rate of late returns, which was the highest among all four brackets.
C: This treats count and rate as interchangeable, which is exactly the error this chapter warns against; they are different kinds of values measuring different things.
D: This is factually incorrect; the under-$30,000 bracket had the highest rate, 38 percent, not the lowest.
6. Correct answer: C
A: This claim asserts direct causation that the table's correlational data alone cannot establish; other factors could explain the pattern.
B: This claim asserts a causal, evaluative judgment about responsibility that the data do not support; the table shows a correlation, not a causal or moral explanation.
C (correct): This claim accurately describes what the data show, a correlation, while explicitly declining to assert a causal mechanism the table itself does not establish.
D: This claim contradicts the data, which do show a clear correlation between income bracket and late-return rates, even though causation is not established.
7. Correct answer: D
A: Nothing establishes that Source C's individual testimony and Source G's structured survey share the same methodology; treating them as one dataset overstates their relationship.
B: This overstates their unrelatedness; the two sources do share a thematic connection around financial pressure and late returns, even though they should not be treated as identical datasets.
C: Nothing in either source establishes that the specific parent in Source C was part of Source G's surveyed population; this claim invents a connection the sources do not support.
D (correct): These two sources genuinely relate: Source C provides an individual account of the kind of pressure that could plausibly relate to the broader pattern Source G documents, without claiming Source C's parent belongs to Source G's exact surveyed population.
8. Correct answer: A
A (correct): This is a clear case of inventing context: the graph's actual variable concerns late returns, not reading habits or personal values, so a claim about valuing reading is not something this data can support at all.
B: This claim is not an accurate summary; the graph contains no information about reading habits or values, only about late-return rates.
C: This claim does not involve a count-versus-rate distinction at all; its problem is that it asserts something the data do not measure in the first place.
D: The claim's problem is not population scope; it is that the claim addresses a variable, reading values, the graph never measures at all.