SAT Reading & Writing study guide · Chapter 30
Quick Reference 6: Match Graph Data to the Claim
Reference 6: Match Graph Data to the Claim
A correct number can still support the wrong conclusion, when the group, the unit, the time point, or the comparison is not the one the claim actually needs. Before trusting any answer built from a graph or a table, run these six questions.
What is measured? Which group? What unit? Which time point? Is the claim about level or change? Is it asking for association or cause?
Final Level and Largest Increase
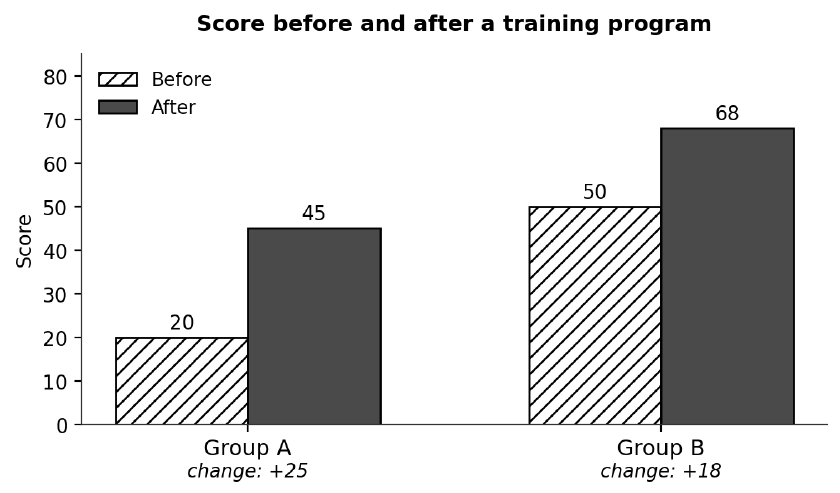
Group B ends with the higher score, 68 against 45. That answers a question about final standing. It does not answer a question about improvement. Group A gained 25 points; Group B gained 18. A claim about which group improved more is answered by the change, not by which bar is taller at the end.
Percentage and Count
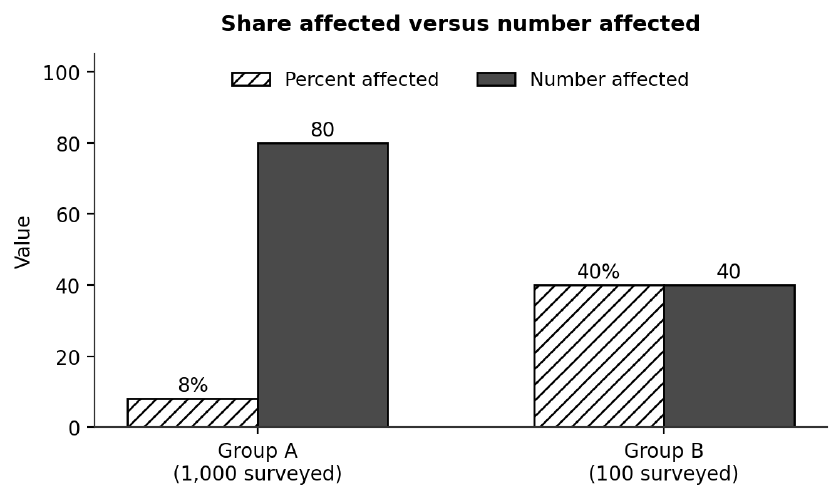
Group B has the higher percentage affected, 40 percent against 8 percent. Group A has the larger number of people affected, 80 against 40, because Group A’s surveyed population was ten times the size. A claim about share and a claim about raw count are two different comparisons built from the same table, and a correct percentage does not answer a question that actually asked about the number of people.
Endpoints and Paths
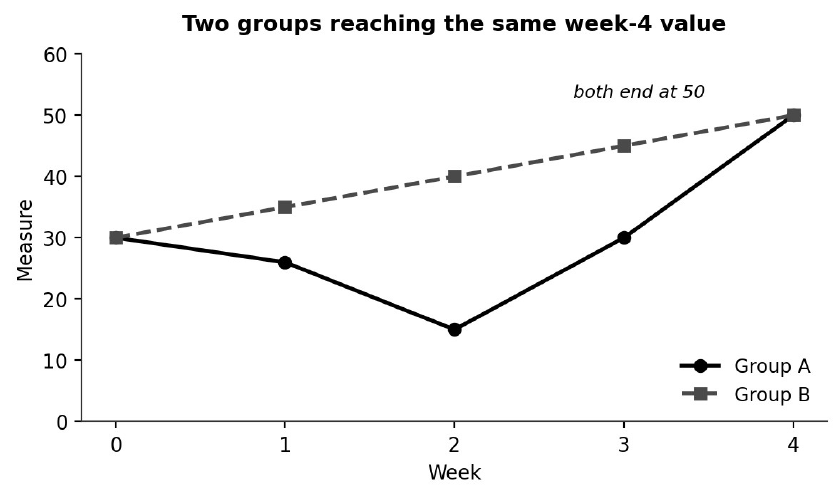
Both groups reach the same value by week four. Group A got there after a sharp dip in week two; Group B rose steadily the entire time. A claim about where each group ended up is true for both. A claim about which group’s trajectory was steadier, or which group recovered from a setback, depends on the shape of the path, not on the shared endpoint.
Association and Causation
A table showing that a variable rose alongside an outcome supports a claim that the two are associated. It does not, by itself, support a claim that one caused the other, unless the study’s design specifically isolated that variable from everything else that changed at the same time. A graph can show a pattern clearly and still say nothing about why the pattern exists.
Before choosing a graph-based answer, say the exact comparison the claim needs, in plain words, before looking back at the numbers. The tallest bar, the steepest line, and the biggest percentage each answer a specific question. Check that it is the one actually being asked.