ACT Math study guide · Chapter 61
Statistics and Probability Timed Practice
Statistics & Probability accounts for roughly 12-15% of the current scored Math blueprint and now includes univariate data, bivariate relationships, formal inferential statistics, probability rules, and counting. This focused mini-section intentionally concentrates those skills under time pressure. It runs 20 questions in 22 minutes and moves from claim-testing and center and spread, through distribution shape, normal distributions and z-scores, study design, margin of error and sampling variability, probability, counting, bivariate models, and closes with a model-comparison item and a high-range stats-and-percent chain.
Work this section in one sitting, under real timing, before checking anything. Afterward, look back at each miss and name the actual cause instead of only the wrong answer: content you didn't know, a question that didn't trigger a rule you did know, a calculation or sign slip, the wrong requested object, a slower tool choice, or time lost before exiting a stuck question.
▸ Questions
1. Find the median of 14, 8, 22, 11, 19.
A) 11 B) 14.8 C) 14 D) 22
2. Find the mean of 6, 9, 12, 15, 18.
F) 60 G) 12 H) 15 J) 10.5
3. A company claims that 40% of customers prefer its new product design. In 1,000 simulations built by assuming the true proportion is exactly 40%, only 12 of the simulated samples produce a result at least as far from 40% as the sample actually observed. Which conclusion is best supported?
A) The observed result is unusual under the 40% claim and provides evidence against it B) The observed result is common under the 40% claim C) The simulations prove the true proportion is not 40% D) The claim must be accepted because simulations were used
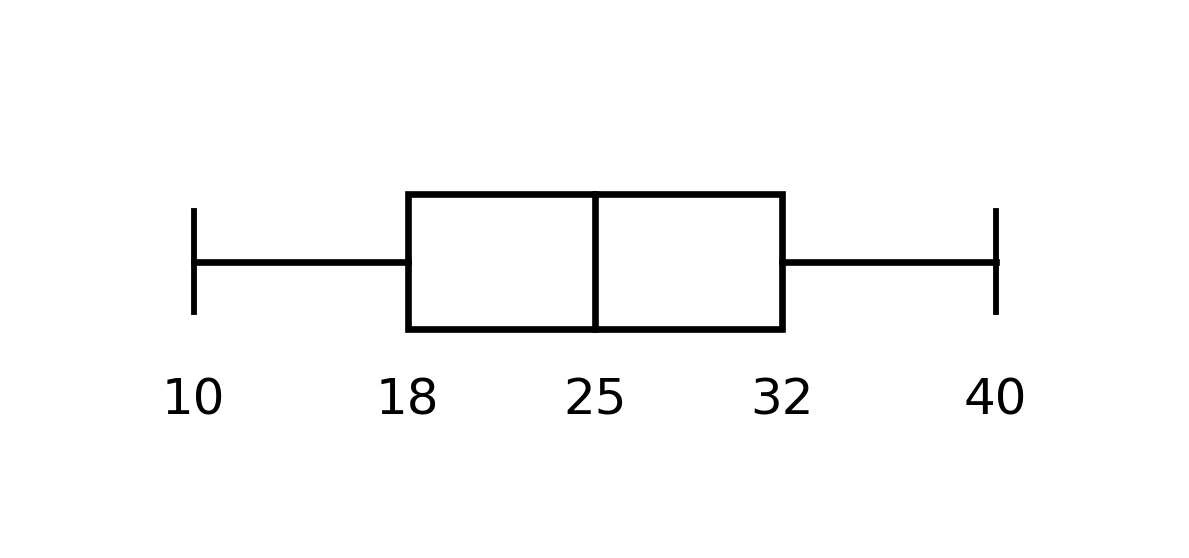
4. A box plot shows a five-number summary of 10, 18, 25, 32, 40. Find the interquartile range.
F) 22 G) 15 H) 14 J) 30
5. A distribution of household incomes is strongly right-skewed, with a small number of very high incomes. Which measure of center best describes a “typical” value in this distribution?
A) The mean B) The range C) The mode D) The median
6. A distribution has mean 74 and standard deviation 8. Find the z-score for a value of 94.
F) 2.5 G) −2.5 H) 8 J) 20
7. A data value has a z-score of 3.2 in a roughly normal distribution. Which best describes this value?
A) It is an impossible value B) It is exactly average C) It is close to the mean D) It is unusually far from the mean
8. A researcher wants to determine whether a new fertilizer increases crop yield. Which study design would allow a causal conclusion?
F) A voluntary response survey G) An observational study H) A case study of one farm J) A randomized controlled experiment
9. A website survey found that 80% of respondents prefer dark mode. The survey link was shown only to users who had already enabled dark mode. What is the primary issue with this survey?
A) The sample is not representative of all users B) The survey question was worded unclearly C) The sample size is too small D) The percentage was calculated incorrectly
10. A study finds that ice cream sales and drowning incidents are positively correlated across different months of the year. Which best explains this correlation?
F) Drownings directly cause higher ice cream sales G) Ice cream sales directly cause drownings H) The correlation has no possible explanation J) A third variable, such as hot weather, likely affects both
11. A poll of 400 people finds that 55% support a proposal, with a margin of error of ±4%. Find the interval of plausible values.
A) 47% to 63% B) 51% to 59% C) 53% to 57% D) 55% to 59%
12. Using the survey from the previous question, is 60% support a plausible population value?
F) Yes, 60% is within the interval G) No, 60% is outside the interval H) It is impossible to say without more data J) Yes, because 60% is close to 55%
13. A simulation draws 500 random samples of size 40 from a population with a true proportion of 0.25. The simulated sample proportions cluster around 0.25 with some spread. What does this spread illustrate?
A) Sampling variability B) An error in the simulation C) An incorrect true proportion D) Bias in the population
14. A jar contains 5 red, 3 blue, and 2 green marbles. Find the probability of drawing a blue marble.
F) 3/10 G) 3/8 H) 5/10 J) 2/10
15. A bag contains 4 red and 3 blue marbles. Two marbles are drawn without replacement. What is the probability that both are red?
A) 4/7 B) 2/7 C) 3/7 D) 1/3
16. In a survey of 120 people, 70 own a dog, 50 own a cat, and 20 own both. Find the probability that a randomly selected person owns a dog or a cat.
F) 5/12 G) 5/6 H) 7/12 J) 1
17. A game costs $4 to play. It pays $20 with probability 0.1. Find the expected net gain or loss per game.
A) −$1.60 B) $1.60 C) −$2 D) $2
18. A line of best fit is y = 2.5x + 10. Find the residual for the data point (4, 25).
F) −5 G) 20 H) 5 J) 25
19. Two models are fit to the same data. Model A has small residuals scattered randomly around 0. Model B has residuals that form a clear curved pattern. Which model is better supported by the residual plots?
A) Model B, because a visible curve is stronger evidence of fit B) Model A, because random residual scatter suggests the main pattern has been captured C) Both models fit equally well D) Residuals cannot be used to compare model fit
20. A store's sales increased 20% from January to February, then decreased 15% from February to March. If January sales were $50,000, find March sales.
F) $51,000 G) $60,000 H) $52,500 J) $50,000
▸ Answers and Explanations
1: C. Ordered: 8, 11, 14, 19, 22. The median is the middle value: 14. Choice B reports the mean of the data set (74/5=14.8) instead of the median.
2: G. Mean = (6+9+12+15+18)/5 = 60/5 = 12. Choice F reports the sum of the values without dividing by the count.
3: A. Only 12 of 1,000 simulated results, or 1.2%, are at least as extreme as the observed sample under the 40% claim. That is rare, so the observed sample is unusual if the claim is true, providing evidence against it. Choice C overstates the conclusion: a rare simulated outcome is evidence against a claim, not mathematical proof that a different value is correct.
4: H. IQR = Q3−Q1 = 32−18 = 14. Choice J uses the full range (40−10=30) instead of the interquartile range.
5: D. A right-skewed distribution has a long tail of high values that pull the mean upward; the median is not affected the same way, making it a better description of a typical value. Choice A reports the mean, which is exactly the measure most distorted by the skew this question describes.
6: F. z = (x−μ)/σ = (94−74)/8 = 2.5. Choice J reports the raw difference (94−74=20) without dividing by the standard deviation.
7: D. A z-score of 3.2 means the value is 3.2 standard deviations from the mean, well beyond the range where most values fall in a roughly normal distribution. Choice C describes a value near the mean, the opposite of what a z-score this large indicates.
8: J. A randomized controlled experiment can support a causal conclusion because it controls for other variables through random assignment. Choice F describes a voluntary response survey, which cannot establish causation and also suffers from self-selection bias.
9: A. Only users who had already enabled dark mode saw the survey, so the sample systematically excludes everyone else, making it unrepresentative of all users. Choice B misidentifies the issue as unclear wording, when the actual problem is who was allowed to respond in the first place.
10: J. Hot weather likely increases both ice cream sales and swimming, which increases drowning risk; this is a classic third-variable explanation, not direct causation in either direction. Choice G claims one event directly causes the other, when a shared underlying cause explains the correlation without either variable causing the other.
11: B. The plausible interval is 55%−4%=51% to 55%+4%=59%. Choice C narrows the interval on both sides instead of applying the full stated margin of error of ±4%.
12: G. The interval from the previous question is 51% to 59%. Since 60% is greater than the upper bound of 59%, it is not a plausible value. Choice F assumes 60% is automatically plausible without checking it against the computed interval.
13: A. Each random sample includes a different subset of individuals purely by chance, so sample proportions naturally vary around the true value; this is sampling variability, not a flaw in the simulation. Choice B attributes the natural spread to an error in the simulation instead of the expected variability from random sampling.
14: F. P(blue) = 3/10, the number of blue marbles over the total number of marbles. Choice G uses 8 as the denominator, omitting the red marbles from the total count.
15: B. Without replacement, the second probability changes after the first red marble is removed: (4/7)(3/6)=12/42=2/7. Choice A reports only the probability that the first marble is red.
16: G. P(dog or cat) = P(dog)+P(cat)−P(both) = (70+50−20)/120 = 100/120 = 5/6. Choice J adds the dog and cat counts without subtracting the overlap, computing (70+50)/120=1.
17: C. Expected value = (20−4)(0.1)+(−4)(0.9) = 1.6−3.6 = −$2. Choice A omits the cost of playing from the winning outcome, computing 20(0.1)−4(0.9) instead of (20−4)(0.1)+(−4)(0.9).
18: H. Predicted value = 2.5(4)+10 = 20. Residual = actual−predicted = 25−20 = 5. Choice G reports the predicted value itself instead of completing the subtraction to find the residual.
19: B. Residuals randomly scattered around 0 suggest that the model has captured the main structure in the data. A curved residual pattern means systematic structure remains unexplained, so Model B is missing part of the relationship. Choice A treats a visible curve as favorable evidence instead of a sign of unexplained structure.
20: F. 50,000×1.20=60,000. Then 60,000×0.85=51,000. Choice G treats the sequential 20% increase and 15% decrease as a simple net 5% change (50,000×1.05=52,500) instead of applying each percentage in sequence.