SAT Math study guide · Chapter 16
One-Variable Data: Distributions, Center, and Spread
A single list of numbers can be summarized by where it centers and how far it spreads. The reasoning the test rewards is knowing how those summaries shift when the data does.
When data comes as a single list of values (test scores, heights, incomes) two questions organize almost everything you can ask about it: where does it center, and how spread out is it? The first is answered by the mean, the median, or the mode; the second by the range and the standard deviation. None of these is hard to compute. What the harder questions test is your grasp of how each summary behaves: how the mean shifts when a value is added, why the median shrugs off an outlier the mean cannot, and what happens to the spread when every value is scaled. That behavior, not the arithmetic, is the real content of this section.
▸ Compare mean, median, and mode
Three numbers compete to describe the center of a list. The mean is the ordinary average, the sum divided by the count. The median is the middle value once the list is ordered (the average of the two middle values when the count is even). The mode is the value that appears most often. On a roughly symmetric list these three sit close together; their differences become important precisely when the list is not symmetric.
The most useful mean questions run backward. Because the mean ties together the sum and the count, knowing any two of those three recovers the third, and that is the engine behind a whole family of harder problems.
WORKED Run the mean backward
The mean of five numbers is 14. Four of them are 10, 12, 15, and 18. Find the fifth.
A mean of 14 over five numbers means the total is 5 × 14 = 70. The four known values sum to 55, so:
fifth value = 70 - 55 = 15.
The move is always the same: turn the mean into a sum, then work with the sum.
▸ Compute means from frequency tables and weighted data
When data arrives in a frequency table, each value paired with how many times it occurs, you read the center without writing the list out. The mean weights each value by its frequency; the median is found by counting inward to the middle position, using a running total of the frequencies.
WORKED Median from a frequency table
A table lists value 2 (frequency 3), value 5 (frequency 4), value 8 (frequency 5), value 11 (frequency 8). The total count is 20, so the median is the average of the 10th and 11th values in order.
Running totals: through 2 reaches position 3; through 5 reaches 7; through 8 reaches 12.
So positions 8 through 12 are all the value 8, including both the 10th and 11th.
median = (8 + 8) / 2 = 8.
Counting positions through the running total is the whole skill; never list out twenty numbers.
A close relative is the weighted mean, which combines groups of different sizes. You cannot simply average the group averages unless the groups are the same size; instead, weight each average by its group's count.
WORKED Combine two group means
One class of 18 students averaged 78; a second class of 12 averaged 88. Find the combined average of all 30.
Recover each group's total, add, and divide by the full count:
(18 × 78 + 12 × 88) / 30 = (1404 + 1056) / 30 = 2460 / 30 = 82.
Averaging 78 and 88 to get 83 would be wrong, because the larger class pulls the combined mean toward its own average.
▸ Read distributions from histograms and dot plots
Two graphical displays organize a long list of values without listing every one, and both group values into bins or stack them by value. A histogram groups values into intervals; SAT-style displays commonly use equal-width bins, and the graph's labels show how frequency is represented for each interval. Because a histogram groups values, it tells you how many observations fall in a range, never the exact value of any one of them.
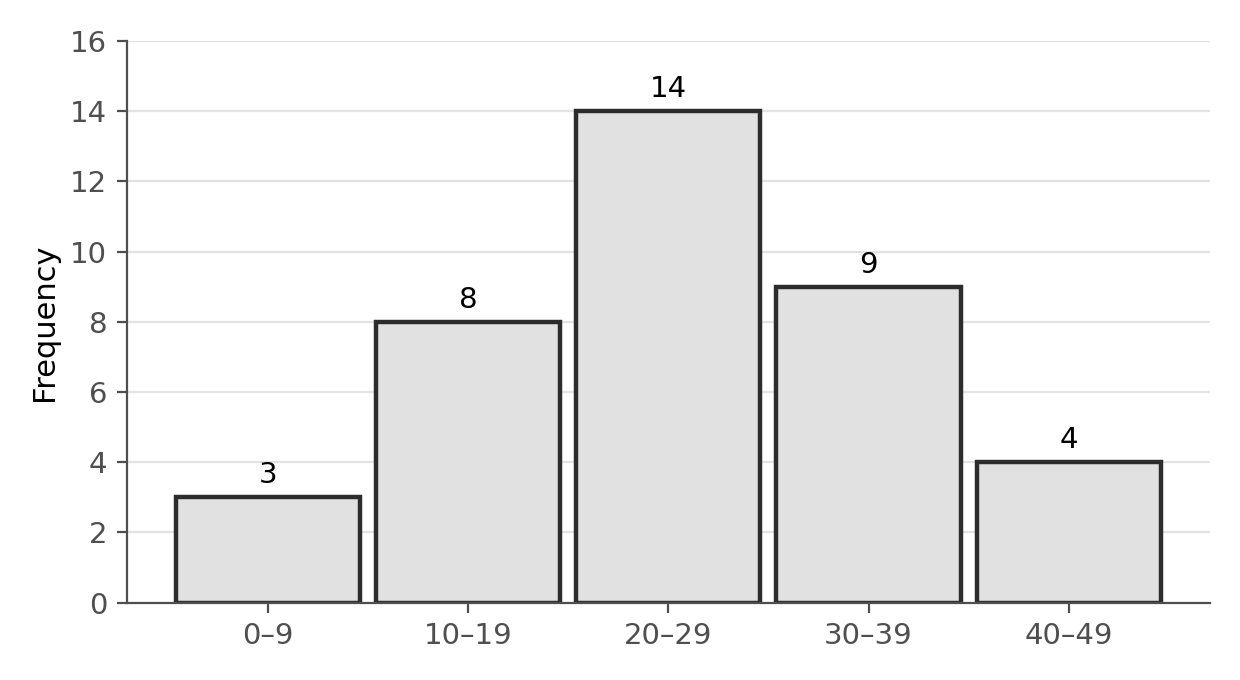
FIGURE 1 A histogram groups values into equal-width intervals; bar height is the frequency in that interval.
WORKED Read a histogram correctly
The tallest bar above spans 20–29, with a frequency of 14. What must be true?
More observations fall in the interval 20–29 than in any other interval shown. Nothing more specific can be said: the histogram does not reveal the exact values inside that bar, or their mean, only the count within the range.
A common misread is to treat the tallest bar as revealing a single most-common value; a histogram groups values, so individual repeats inside a bin stay invisible.
A dot plot keeps every individual value visible instead of grouping them, stacking one dot per observation above its value on a number line. It is most useful for smaller data sets, where a histogram's bins would hide more than they reveal.
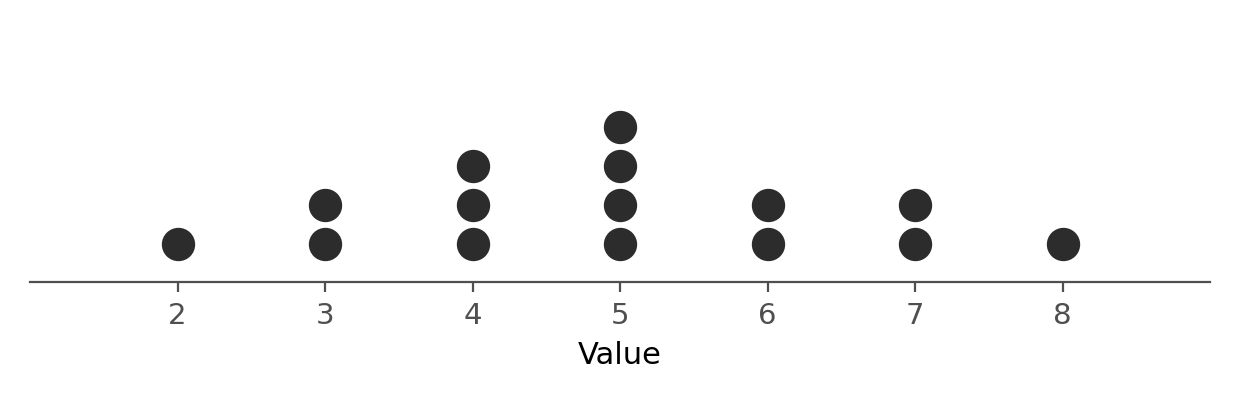
FIGURE 2 A dot plot stacks one dot per observation above its value, keeping every individual value visible.
WORKED Recover the median from a dot plot
The dot plot above shows 15 values. What is the median?
With 15 values, the median is the 8th value once they are ordered. Reading left to right and counting dots: 2, 3, 3, 4, 4, 4, 5. The 8th dot lands on 5.
Unlike a histogram, a dot plot lets you count individual observations directly, which is exactly what finding a median from raw data requires.
▸ Compare spread using range and standard deviation
Center is only half the picture; two lists can share a mean yet look nothing alike. Spread measures how far the values stray from the center. The simplest measure is the range, the largest value minus the smallest: quick, but driven entirely by the two extremes. The far more informative measure is the standard deviation, which captures the typical distance of a value from the mean. You will not compute it by hand on this test, but you must reason about it: a list whose values huddle near the mean has a small standard deviation, while one whose values are flung wide has a large one.
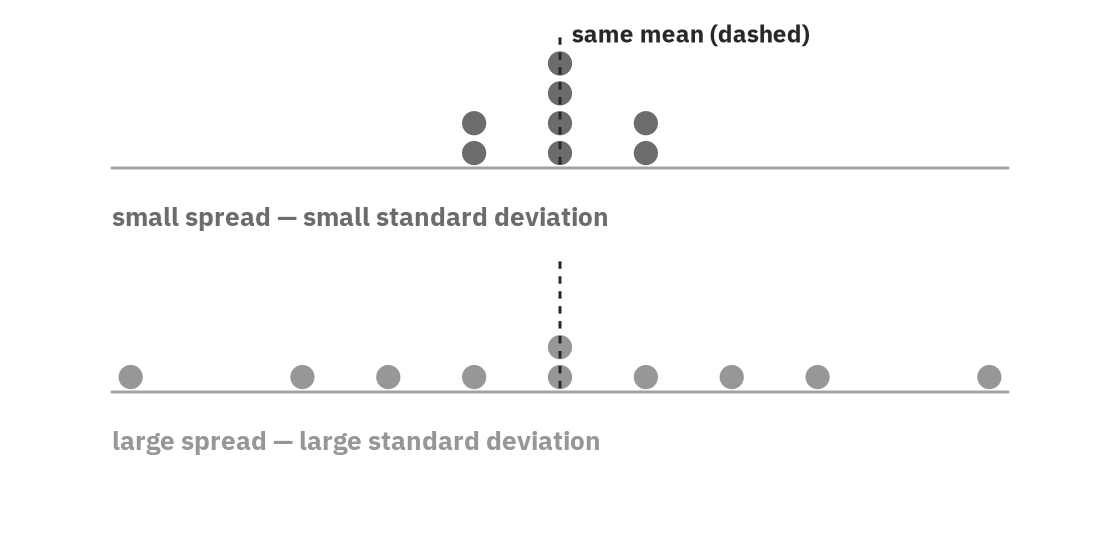
FIGURE 3 Two lists can share a mean and differ entirely in spread. Standard deviation measures the typical distance from that shared center.
So when a question shows two distributions with the same center and asks which has the greater standard deviation, you are being asked to see the spread, not calculate it: the more the values scatter away from the middle, the larger the standard deviation.
WORKED Different means, the same standard deviation
Data set A has a mean of 50 and a standard deviation of 8. Data set B is formed by adding 10 to every value in set A. What are the mean and standard deviation of set B?
Adding the same constant to every value slides the whole distribution without changing how spread out it is: the mean shifts by that constant, 50 + 10 = 60, but the standard deviation is unchanged at 8. Two distributions can therefore look nothing alike in center while sharing an identical spread; the question tests whether you separate the shift, which moves the mean, from the shape, which fixes the standard deviation.
▸ Read quartiles and interquartile range from box plots
A scope note: box plots themselves are a named current testing point, so locating the minimum, quartiles, median, and maximum on one is worth knowing. Computing the IQR as its own named quantity is not itself a current testing point; treat it as a natural byproduct of reading the box, not a separate fact to drill.
A box plot summarizes a full distribution using five landmark values: the minimum, the first quartile (Q1), the median, the third quartile (Q3), and the maximum. Quartiles split the ordered data into four equal groups; Q1 is the median of the lower half, Q3 is the median of the upper half. The box itself spans Q1 to Q3, the middle half of the data, with whiskers reaching out to the minimum and maximum.
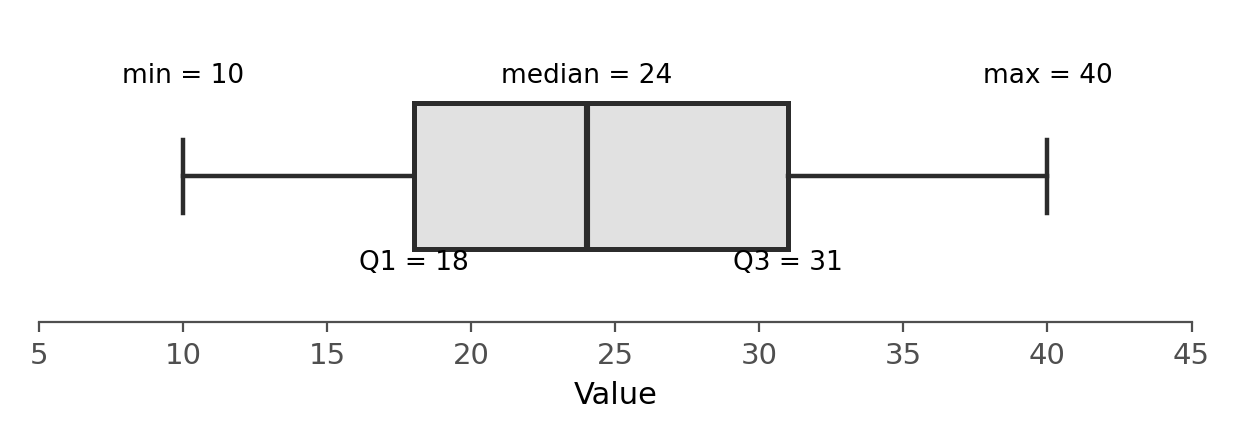
FIGURE 4 A box plot: the box spans Q1 to Q3 with the median marked inside; whiskers reach the minimum and maximum.
The interquartile range, IQR, is the width of the box, Q3 minus Q1, and it measures spread the same way the range does, but resistant to outliers, since it ignores the most extreme quarter on each end.
WORKED Find the IQR from a box plot
The box plot above has Q1 = 18 and Q3 = 31. What is the IQR?
IQR = Q3 − Q1 = 31 − 18 = 13
Confusing the IQR with the whisker-to-whisker span, the full range, is the usual slip; the IQR is the width of the box alone, the middle 50 percent of the data.
▸ Describe distribution shape, center, spread, and outliers
How a list is shaped (symmetric, or stretched out to one side) decides how its center measures relate. In a symmetric distribution the mean and median nearly coincide. But when a long tail stretches to one side, the values out in that tail drag the mean toward them, while the median, which only cares about position, barely moves. The result is a reliable signal.
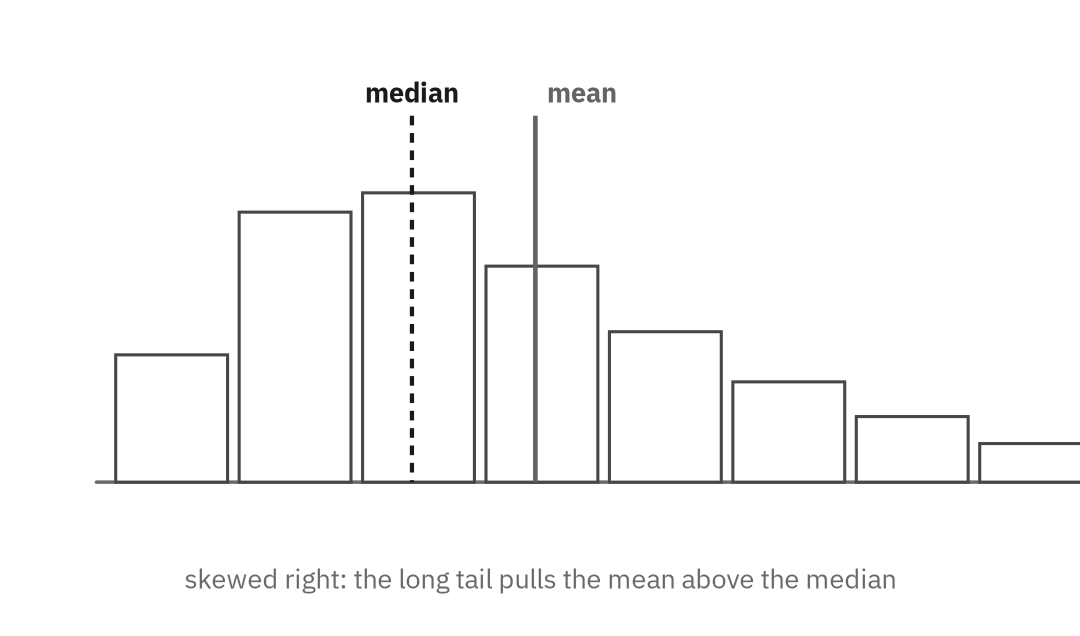
FIGURE 5 In a right-skewed distribution the long tail pulls the mean above the median; the median stays near the bulk of the data.
How skew changes the mean and median
Symmetric: mean and median are nearly equal.
Skewed right (long tail of high values): mean > median.
Skewed left (long tail of low values): mean < median.
This runs in both directions. Shown a shape, you can predict the order of mean and median; told that the mean exceeds the median, that pattern typically points to a right skew, a useful heuristic rather than a guarantee for every possible dataset.
▸ Choose median and IQR when outliers distort mean and range
An outlier, a single value far from the rest, exposes the deepest difference between the mean and the median. The mean, built from the sum, feels every value in full, so one extreme number can drag it a long way. The median, built from position, registers an outlier as just one more value at the end and scarcely moves. The median is resistant; the mean is sensitive.
WORKED Watch an outlier move each measure
A list of nine values has mean 50 and median 50. The largest value, 80, is replaced by 200; a jump of 120.
The median depends only on the middle position, which is unchanged, so it stays at 50.
The mean rises by the added amount spread over nine values: 120 / 9, about 13.3, lifting it to roughly 63.3.
One value moved; the mean followed it and the median did not. That gap is the whole idea of resistance.
▸ Predict how shifts and scaling affect summary statistics
A final behavior worth knowing cold: what happens to these summaries when every value in a list is changed the same way. Two cases cover the test. Adding a constant to every value slides the whole list along: the mean and median both shift by that constant, but the spread does not change, because every value moved together. Multiplying every value by a constant scales everything: the mean, the median, and the standard deviation all multiply by that same factor.
How transformations change center and spread
Add c to every value: mean and median rise by c; range and standard deviation are unchanged.
Multiply every value by k: mean and median multiply by k; range and standard deviation multiply by |k|, since a spread cannot be negative.
WORKED Transform a whole list
A list has mean 20 and standard deviation 4. Every value is multiplied by 3, and then 5 is added.
Multiplying by 3 scales both: mean becomes 60, standard deviation becomes 12.
Adding 5 shifts the mean to 65 but leaves the standard deviation at 12, since a shift moves every value together.
new mean = 3(20) + 5 = 65, new standard deviation = 3 × 4 = 12.
The order matters for the mean but not for the spread, which only the multiplication touched.
▸ Choose center or spread measures that match the question
All of this serves one judgment: which summary honestly represents the data. For a roughly symmetric list, the mean is the natural center. For a strongly skewed one, household incomes pulled upward by a few very high earners is the standard example, the median better captures a typical value, because the mean is inflated by the tail. The test often frames this as a choice: which measure best describes the center, and would the mean sit above or below the median? Read the shape, name the skew, and the answer follows.
▸ Practice: one-variable data
1. The mean of five integers is 12. Four of them are 8, 10, 15, and 16. What is the fifth integer? (grid-in)
2. A class of 18 students has a mean test score of 78, and a second class of 12 students has a mean of 88. What is the mean score of all 30 students combined? (grid-in)
Question 3
- A. the mean and median both increase
- B. the median increases but the mean is unchanged
- C. the mean increases but the median is unchanged
- D. neither the mean nor the median changes
4. Every value in a data set is multiplied by 3, and then 5 is added to each result. If the original standard deviation was 4, what is the new standard deviation? (grid-in)
Question 5
- A. skewed left
- B. symmetric
- C. skewed right
- D. uniform
6. A frequency table records value 2 (frequency 3), value 5 (frequency 4), value 8 (frequency 5), and value 11 (frequency 8). What is the median of the 20 values? (grid-in)
7. A set of 8 values has a mean of 15. When a ninth value is added, the mean becomes 16. What is the ninth value? (grid-in)
8. The average of a list of 6 numbers is 10. The average of 4 of those numbers is 7. What is the average of the remaining 2 numbers? (grid-in)
9. Each value in a data set with mean 20 first has 4 subtracted from it, and the result is then doubled. What is the mean of the new data set? (grid-in)
Question 10
- A. mean < median < mode
- B. mode < median < mean
- C. median < mean < mode
- D. mean = median = mode
Question 11
- A. the mean; the mean is below the median
- B. the median; the mean is above the median
- C. the mean; the mean is above the median
- D. the median; the mean is below the median
12. Your scores on four tests are 82, 76, 90, and 85. What score on a fifth test would make the mean of all five exactly 85? (grid-in)
Question 13
- A. W
- B. X
- C. Y
- D. Z
14. A data set of 10 numbers has a mean of 6. A number equal to 6 is removed from the set. What is the mean of the remaining 9 numbers? (grid-in)
Question 15
- A. The mode of the data set is exactly 24
- B. More observations fall in 20–29 than in any other interval
- C. The mean of the data set is between 20 and 29
- D. All 15 values in that interval are equal
16. A dot plot shows one dot per observation for the values 2, 2, 3, 4, 4, 4, 5, 6, 8. What is the median value? (grid-in)
17. A box plot shows Q1 = 14, median = 21, Q3 = 32, minimum 8, and maximum 45. What is the value of Q3? (grid-in)
18. For the same box plot, what is the range of the data set? (grid-in)
19. Every value in a data set is transformed to -2x + 7. If the original standard deviation was 5, what is the new standard deviation? (grid-in)
▸ Solutions: one-variable data
1: 11. Turn the mean into a sum: the five integers total 5 × 12 = 60. The four known values sum to 49, so the fifth is 60 - 49 = 11.
2: 82. Weight each average by its class size: (18 × 78 + 12 × 88)/30 = (1404 + 1056)/30 = 2460/30 = 82. Simply averaging 78 and 88 ignores the unequal class sizes.
Show the answers and explanations
3: C. The median depends only on the middle position, which the change does not move, so it stays at 50. The mean, built from the sum, rises because one value grew by 120. So the mean increases while the median is unchanged.
4: 12. Multiplying every value by 3 scales the standard deviation by 3, giving 12; adding 5 shifts every value equally and leaves the spread unchanged. So the new standard deviation is 12.
Show the answers and explanations
5: C. A mean above the median signals a long tail of high values pulling the mean upward, a right skew. A left skew would put the mean below the median.
6: 8. With 20 values, the median averages the 10th and 11th. Running totals reach 3 through value 2, 7 through value 5, and 12 through value 8, so positions 8 through 12 are all 8. Both the 10th and 11th are 8, so the median is 8.
7: 24. The first eight total 8 × 15 = 120. After the ninth, nine values average 16, a total of 9 × 16 = 144. The ninth value is 144 - 120 = 24.
8: 16. All six total 6 × 10 = 60; the four total 4 × 7 = 28. The remaining two sum to 60 - 28 = 32, so their average is 32/2 = 16.
9: 32. Subtracting 4 from every value drops the mean to 20 - 4 = 16; doubling then scales it to 2 × 16 = 32. The two operations apply to the mean in the same order they apply to the values.
Show the answers and explanations
10: A. The mean is 98/8 = 12.25, the median is (12 + 15)/2 = 13.5, and the mode is the most frequent value, 15. In increasing order, 12.25 < 13.5 < 15, so mean < median < mode.
11: B. With a strong right skew, the median better represents a typical household, since the mean is inflated by the few very high incomes, placing the mean above the median.
12: 92. A mean of 85 across five tests needs a total of 5 × 85 = 425. The first four sum to 333, so the fifth must be 425 - 333 = 92.
Show the answers and explanations
13: D. All four sets share the mean 10, so spread alone decides. Set W’s values are all identical, so its standard deviation is 0. Moving from X to Y to Z, the two outer values sit progressively farther from the mean while the two inner values stay fixed at 10, so the typical distance from the mean grows at each step. Set Z, with values reaching 9 units from the mean, has the greatest standard deviation.
14: 6. The ten numbers total 10 × 6 = 60. Removing a value of 6 leaves a total of 54 over 9 numbers: 54/9 = 6. Removing a value equal to the mean leaves the mean unchanged.
Show the answers and explanations
15: B. A histogram groups values into bins, so it reveals only how many observations fall in each range, never the exact values inside a bin. The tallest bar means more observations fall in 20–29 than in any other interval; nothing more specific can be concluded. Choice A assumes a single repeated value, and choice D assumes every value in the bin is identical, neither of which the grouped data can show.
16: 4. With 9 values already in order, the median is the 5th value: reading 2, 2, 3, 4, 4, 4, 5, 6, 8, the 5th value is 4. A dot plot lets you count individual observations directly, unlike a histogram.
17: 32. Q3 is the right edge of the box and is given directly as 32.
18: 37. The range is the maximum minus the minimum: 45 - 8 = 37. Confusing this with the interquartile range, the width of the box alone, is the usual slip.
19: 10. Multiplying every value by a constant scales the standard deviation by the absolute value of that constant, since spread cannot be negative: |-2| × 5 = 10. The added constant, +7, shifts every value together and has no effect on the spread.
▸ One-variable data: chapter summary
A list of numbers is summarized by its center and its spread, and the points live in how those summaries move. The mean ties sum to count, so most hard questions run it backward or weight it across groups. The median holds the middle position, which makes it resistant to outliers the sensitive mean chases. Shape links them: a tail to the high side pulls the mean above the median. Adding a constant shifts center but not spread; multiplying scales both. Read what the data is doing, decide which summary tells the truth about it, and the arithmetic is the easy part.