SAT Math study guide · Chapter 17
Two-Variable Data: Models and Scatterplots
When two quantities are measured together, a scatterplot shows their relationship and a fitted model summarizes it. The work that scores is interpreting that model, and knowing how far to trust it.
When each subject in a study is measured on two quantities at once (hours studied and a score, age and height, time and temperature) the data becomes a set of paired values, and a scatterplot is the picture of it: one dot for each pair. The scatterplot reveals whether the two quantities move together, and if they do, a model, usually a line, can be drawn to summarize the relationship. From there the questions are almost entirely about interpretation: what the model's slope and intercept mean in the situation, how to use the model to predict, and, just as important, how far past the data you may responsibly reach.
▸ Describe direction, strength, and form in scatterplots
Reading a scatterplot starts with three impressions, taken together. The direction of the association: as one variable rises, does the other tend to rise (positive) or fall (negative)? The form: do the points cluster around a straight line, or curve? And the strength: do they hug the trend tightly, or scatter loosely around it? These three (direction, form, strength) are the vocabulary for describing any scatterplot before a single number is computed.
▸ Interpret and use a line of best fit
When the form is roughly linear, a line of best fit (also called a trend line) is drawn to summarize the relationship. Its defining feature is one that is easy to overlook: it does not pass through every point, and usually through few or none. It summarizes the overall linear trend in the data without needing to pass through any observed point at all; the points still scatter, and the line captures only the pattern running through them. On the SAT, the useful skill is interpreting a given fitted line and its predictions, not constructing one by eye.
▸ Interpret slope and intercept of a data model in context
A common task is interpreting the slope and intercept of a fitted model in the context and units of the data. A line of best fit is still y = (slope)x + (intercept), and each piece carries a concrete meaning in the situation. The slope is a rate of change: the predicted change in y for each one-unit increase in x, carrying the units of y per unit of x. The intercept is the predicted value of y when x is zero. Interpreting these correctly, in the units of the problem, is what the test asks again and again.
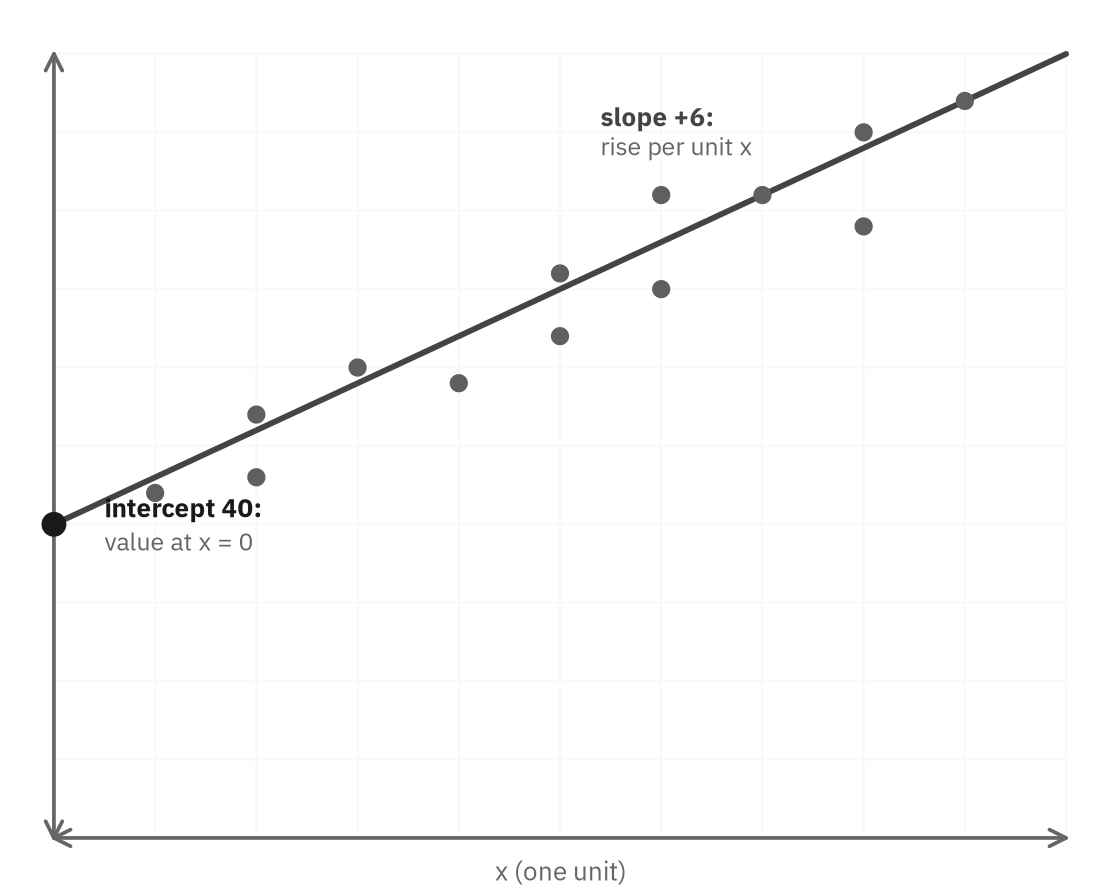
FIGURE 1 A line of best fit summarizes the trend. Its slope is the predicted change in y per unit of x; its intercept is the predicted y at x = 0.
WORKED Interpret a fitted model
A study models a channel's subscribers as y = 2.5x + 18, where x is years since launch and y is subscribers in thousands.
Slope 2.5: for each additional year, the model predicts about 2.5 thousand (that is, 2,500) more subscribers.
Intercept 18: at launch (x = 0), the model predicts 18 thousand subscribers.
Every interpretation question is this: attach the slope to “per unit of x” and the intercept to “at x = 0,” both in the problem's own units.
▸ Use a model for prediction and recognize limits of extrapolation
A fitted model is a prediction machine: substitute an x and read off the predicted y. Predicting within the range of the data, interpolation, is the model's home ground and is usually reliable. Predicting outside that range, extrapolation, is where care is required, because there is no evidence the trend continues beyond where it was measured. A line fit to a battery draining over an hour might predict a charge below zero after two hours, which is meaningless; a population growing linearly for twenty years cannot be assumed to grow forever. The model is trustworthy across the data it summarizes, and progressively less so the farther past that range you push it.
WORKED Predict, then judge the prediction
Using y = 2.5x + 18, the prediction at x = 6 years is 2.5(6) + 18 = 33 thousand subscribers: an interpolation inside the data, and reasonable.
The prediction at x = 40 years is 2.5(40) + 18 = 118 thousand, but the data covered only the first several years, so this far extrapolation rests on the unproven hope that linear growth continues for decades.
The arithmetic is identical; the confidence is not.
▸ Interpret residuals as observed-minus-predicted error
A scope note: "residual" is not itself a named current Digital SAT testing point, while fitting quadratic and exponential models to a scatterplot explicitly is. Keep this section for the model-fit intuition it builds, but do not let it crowd out practice on choosing and fitting a model family, the section that follows.
No model fits perfectly, and the gap between reality and the model has a name: the residual of a data point is its actual y minus the value the model predicts there. A point above the line has a positive residual (the model under-predicted it); a point below has a negative one. Residuals are how you measure, point by point, where the model runs high and where it runs low.
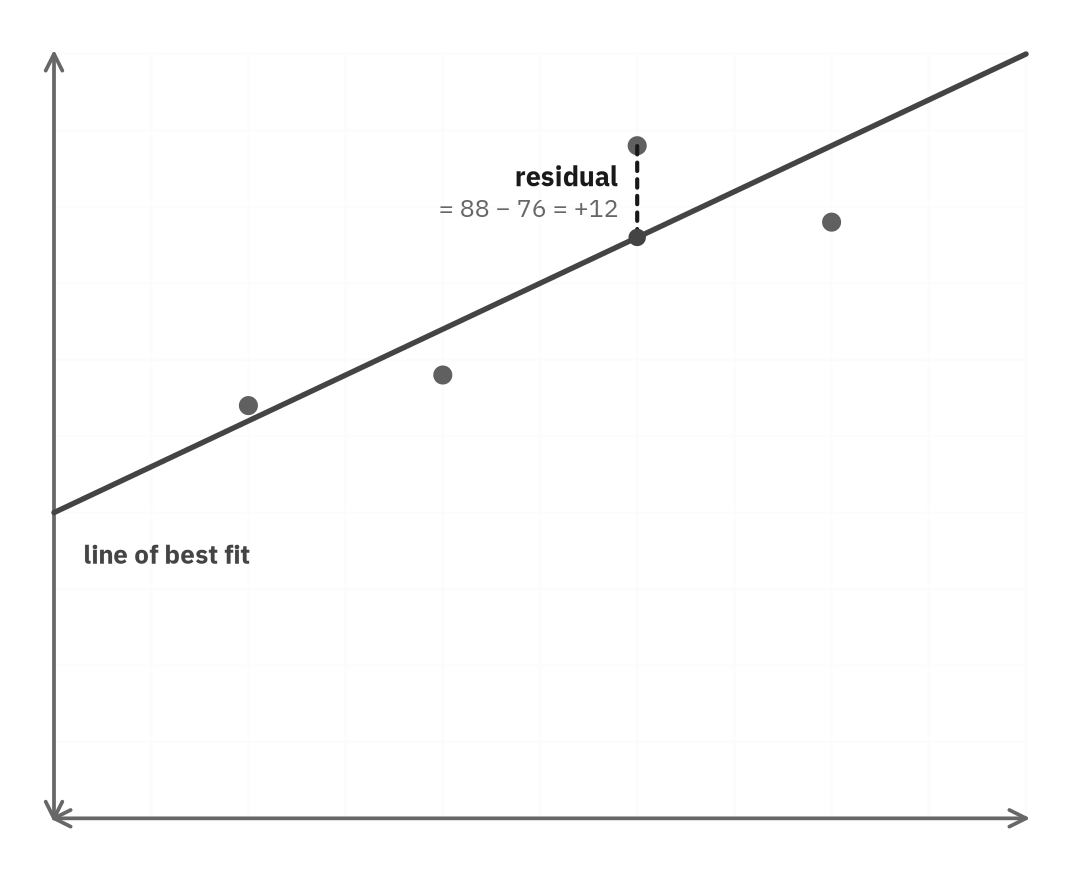
FIGURE 2 A residual is the vertical gap from a data point to the line: actual minus predicted. Points above the line have positive residuals.
The pattern of residuals also judges the model itself. If the residuals scatter randomly above and below zero, a line is a fair summary. But if they follow a pattern (negative at the ends and positive in the middle, say, or steadily growing) that pattern is evidence the true relationship is curved, and a line is the wrong shape for it.
▸ Choose a model that matches the data pattern
Not every relationship is linear, and part of the skill is recognizing which shape the data calls for. The test from the growth section transfers directly: if the quantity changes by a roughly constant amount for each step in x, a line fits; if it changes by a roughly constant ratio, multiplying by about the same factor each step, an exponential curve fits. Reading the data's pattern of change, not just its upward or downward drift, tells you which model to reach for.
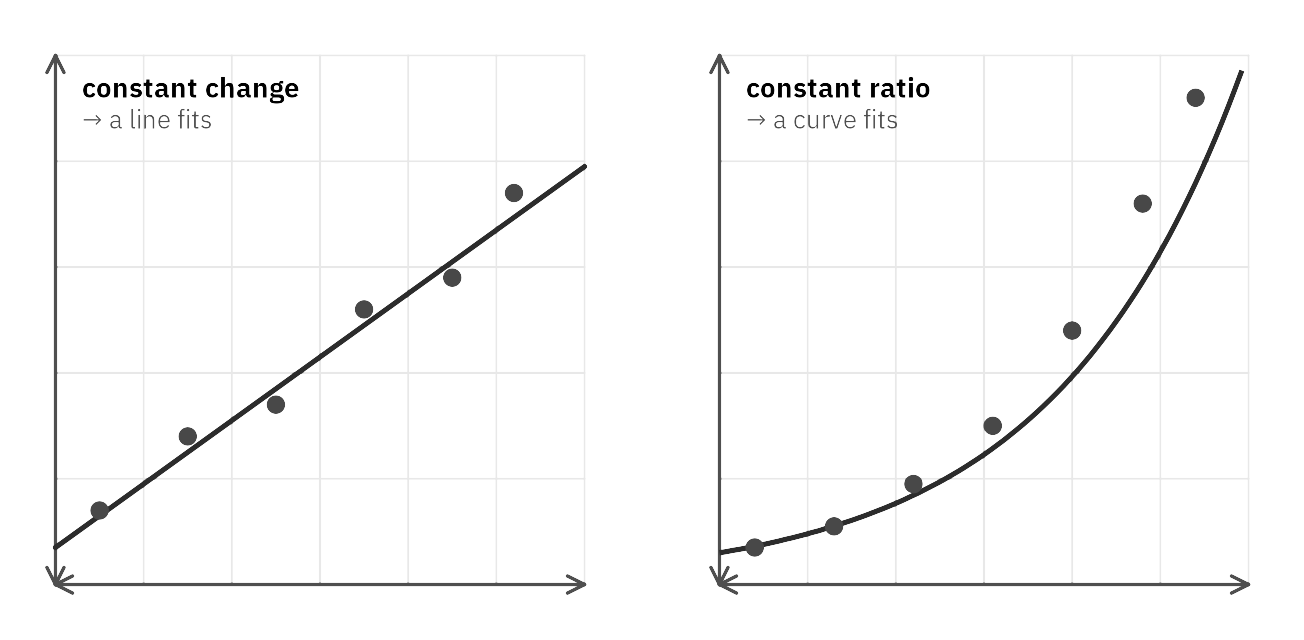
FIGURE 3 Constant change calls for a line; constant ratio (repeated multiplying) calls for an exponential curve.
A third pattern of change fits neither a line nor an exponential curve: a quadratic, where the amount of change itself changes by a constant amount each step, rather than the value changing by a constant amount or a constant ratio. Reading the differences between consecutive values, and then the differences of those differences, tells the three apart.
WORKED Recognize a quadratic pattern
A table shows y-values 3, 7, 13, 21, 31 at equally spaced x-values. Which model family fits best?
The differences between consecutive values are 4, 6, 8, 10, not constant, so it is not linear. Take the differences of those differences: 2, 2, 2, constant.
A constant second difference is the signature of a quadratic model; neither a line (constant first difference) nor an exponential curve (constant ratio) produces one.
Desmos handles the fitting itself once the family is chosen: entering the data as a table and fitting y₁ ~ ax₁² + bx₁ + c returns the coefficients directly, exactly as the linear and exponential regressions do.
WORKED Choose a model family directly from a scatterplot
The scatterplot below shows five data points. Which model family, linear, quadratic, or exponential, best fits the pattern shown?
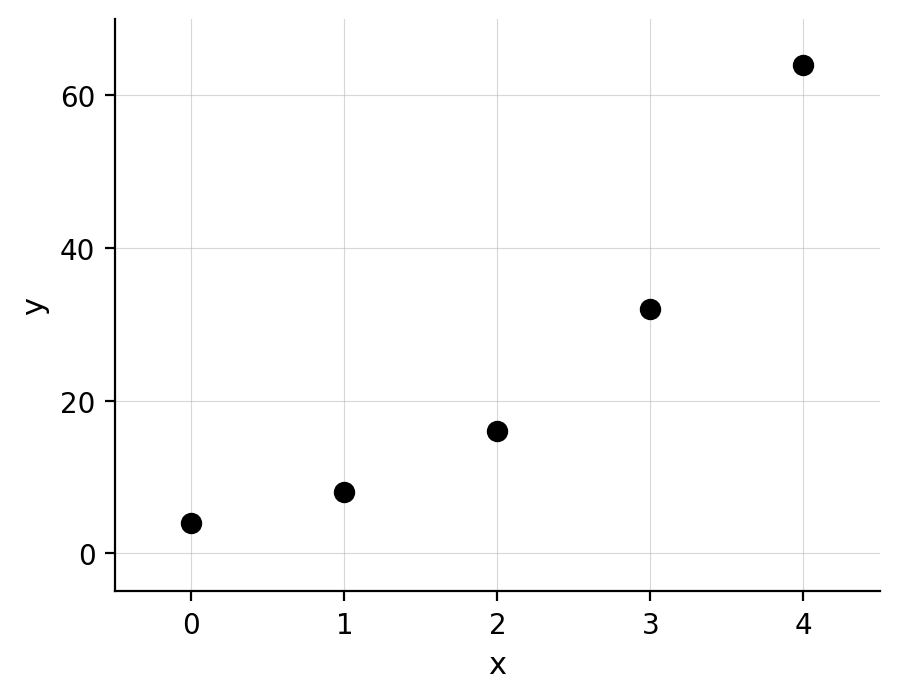
FIGURE 3B Five points curving upward with a visibly accelerating rise.
The points are not spread around a straight line, so linear is out. The curve does not simply bend once like a parabola’s vertex; it accelerates continuously, climbing faster and faster as x increases, each step roughly doubling the height of the last. That accelerating, ever-steepening shape, not just “curved,” is the visual signature of exponential growth rather than a quadratic. Reading the shape directly from the picture, without ever building a table of differences, is the skill this scatterplot is testing.
▸ Distinguish association from causal inference
One caution closes the section. A strong association between two variables (even a tight, clean line) does not by itself establish that one causes the other. Two quantities can move together because one drives the other, because both are driven by some third factor, or by coincidence in a small sample. Deciding whether a relationship is causal depends on how the data was collected, not on how strong the association looks, a distinction the final section of this domain takes up in full. For now, hold the line: a scatterplot can show that two things move together, but moving together is not the same as one making the other happen.
▸ Compare predictions from two competing models
When two models describe the same situation, a question can ask not for one model’s prediction but for how the two compare: where they agree, and which pulls ahead afterward. Set the two expressions equal to find where the predictions match, then compare the rates to see which wins beyond that point.
Model A predicts a store’s weekly sales as y = 500 + 50x; model B predicts y = 550 + 40x, where x is the number of weeks since opening. For what value of x do the two models agree, and which model predicts higher sales after that point?
500 + 50x = 550 + 40x → 10x = 50 → x = 5
Both models predict 750 at x = 5. Beyond that week, the comparison is a matter of rate, not another equation: model A grows by 50 each week against model B’s 40, so model A overtakes model B and stays higher for every x beyond 5. Checking x = 8 confirms it: model A gives 900, model B gives 870.
▸ Practice: two-variable data
Question 1
- A. the channel began with 2,500 subscribers
- B. subscribers grow by about 2,500 each year
- C. subscribers grow by about 18,000 each year
- D. the channel had 2.5 subscribers at launch
Question 2
- A. the yearly growth in subscribers
- B. the predicted subscribers, in thousands, at launch
- C. the number of years modeled
- D. the maximum number of subscribers
3. A line of best fit predicts y = 52 when x = 8, while the observed data point at x = 8 is y = 58. What is the residual at that point? (grid-in)
4. A line of best fit passes through the points (2, 30) and (6, 50). Using this line, what value does it predict when x = 10? (grid-in)
Question 5
- A. y = 2x + 15
- B. y = 2x - 15
- C. y = 2x + 25
- D. y = 2x - 5
6. A model V = -3t + 90 gives a battery's charge as a percent after t minutes. After how many minutes does the model predict a charge of 0 percent? (grid-in)
Question 7
- A. uses the wrong slope
- B. interpolates within the data
- C. extrapolates far beyond the observed data
- D. ignores the intercept
8. A line of best fit is h = 1.8w + 4, giving a plant's height in centimeters after w weeks. By how many centimeters does the model predict the plant grows between week 3 and week 8? (grid-in)
9. A table gives x = 0, 1, 2, 3 and y = 3, 6, 12, 24. If the pattern continues under the best-fitting model, what is y when x = 5? (grid-in)
Question 10
- A. linear
- B. quadratic
- C. exponential
- D. constant
Question 11
- A. one variable causes the other
- B. the two variables tend to move together
- C. a third variable is responsible
- D. the association is a coincidence
Question 12
- A. 3 below the line
- B. exactly on the line
- C. 3 above the line
- D. 7 above the line
Question 13
- A. a line through the origin
- B. a linear model with positive slope
- C. an exponential model
- D. a model with zero slope
Question 14
- A. a calculation error in the model
- B. the risk of extrapolating far beyond the data
- C. that the population is actually constant
- D. that the slope must be positive
Question 15
- A. linear, since the outputs increase every step
- B. exponential, since the ratio of outputs changes
- C. quadratic, since the second differences are constant
- D. none of these, since no pattern in the differences appears
▸ Solutions: two-variable data
Show the answers and explanations
1: B. The slope 2.5 is the change in y per one-unit change in x: here, 2.5 thousand subscribers per year, or about 2,500 each year. Choice A misreads the slope as a starting value; choice C swaps in the intercept.
2: B. The intercept is the predicted y when x = 0, at launch, and y is in thousands, so it predicts 18 thousand subscribers. The intercept is a starting value, not a rate.
3: 6. The residual is actual minus predicted: 58 - 52 = 6. It is positive because the observed point lies above the line.
4: 70. The slope is (50 - 30)/(6 - 2) = 20/4 = 5. From (6, 50), moving to x = 10 adds 5(4) = 20, predicting 50 + 20 = 70.
Show the answers and explanations
5: B. The old x equals the new x minus 10. Substitute: y = 2(x - 10) + 5 = 2x - 15.
6: 30. Set the charge to zero: -3t + 90 = 0, so 3t = 90 and t = 30 minutes. This is the model's x-intercept.
Show the answers and explanations
7: C. The value x = 50 lies far outside the data's range of 5 to 20, so the prediction extrapolates well beyond where the trend was observed and may not hold. Interpolation, by contrast, stays inside the data.
8: 9. The change in height depends only on the slope and the change in weeks: 1.8 × (8 - 3) = 1.8 × 5 = 9 centimeters. The intercept does not affect a change.
9: 96. The y-values multiply by 2 each step (3, 6, 12, 24), a constant ratio, so the model is exponential: y = 3 × 2x. At x = 5, y = 3 × 32 = 96.
Show the answers and explanations
10: B. First differences are 4, 6, 8; second differences are constant at 2, the signature of a quadratic model.
11: B. A strong linear association shows only that the variables tend to move together. It does not establish that one causes the other, which could instead be due to a third factor or to chance.
12: C. The line predicts y = 4(5) + 12 = 32, while the observed value is 35. Since 35 - 32 = 3 and is positive, the point lies 3 above the line.
13: C. A constant percentage change each period means multiplying by the same factor repeatedly, the signature of an exponential model. A linear model would require a constant amount of change instead.
14: B. The model was fit to data from 2000 to 2020, so a prediction for 2200 reaches almost two centuries beyond it. A negative population is the sign that the linear trend cannot be extended that far.
15: C. The first differences between consecutive outputs are 5 - 2 = 3, 10 - 5 = 5, and 17 - 10 = 7, not constant, so the pattern is not linear. Taking differences of those differences gives 5 - 3 = 2 and 7 - 5 = 2, constant. A constant second difference is the signature of a quadratic model; neither a line nor an exponential curve produces one.
▸ Two-variable data: chapter summary
A scatterplot shows whether two measured quantities move together, in what form, and how tightly; a line of best fit summarizes a linear trend without passing through every point. The slope is a rate (change in y per unit of x, in the problem's units) and the intercept is the predicted y at x = 0; interpreting those correctly is the most-tested skill here. Use the model to predict inside the data with confidence and outside it with caution, read residuals to see where and whether the model fits, choose a curve over a line when the change is by ratio rather than amount, and never mistake a tight association for proof of cause.