SAT Math study guide · Chapter 18
Probability and Conditional Probability
Probability is a proportion of outcomes, and the hard part is almost never the arithmetic. It is reading the word “given”, which quietly shrinks the group you are dividing by.
Probability measures how likely an outcome is, on a scale from 0 (impossible) to 1 (certain), and at heart it is the proportional reasoning of this domain's first section pointed at chance. For equally likely outcomes it is a simple ratio, favorable outcomes over total outcomes, and on this test it most often appears as data in a two-way table. The arithmetic stays easy throughout; the difficulty is entirely in reading which outcomes count and, above all, which group you are dividing by. That second question is what the word “given” controls, and it is where this section concentrates its attention.
▸ Interpret probability as favorable outcomes over a sample space
For a process whose outcomes are equally likely, the probability of an event is the number of outcomes in the event divided by the total number of outcomes. Because it is a proportion, it always lands between 0 and 1, and the probability that an event does not happen, its complement, is simply 1 minus the probability that it does. The complement is a quiet workhorse: when an event is awkward to count directly, counting the opposite and subtracting from 1 is often far easier.
▸ Estimate probability from observed frequencies
When the outcomes are not equally likely, or when you simply have a record of what happened, probability is estimated by relative frequency: the fraction of observed cases in which the event occurred. If 90 of 150 surveyed households own a pet, the probability that a randomly chosen one owns a pet is taken to be 90/150 = 0.6. This form turns any table of counts into a source of probabilities.
▸ Read joint, marginal, and conditional frequencies from two-way tables
A two-way table sorts a group by two characteristics at once, with row and column totals around the edges. Two-way tables are a common SAT representation because one table can support joint, marginal, and conditional probabilities. Read it carefully: the inner cells are joint counts (both characteristics at once), the margins are single-characteristic totals, and the grand total sits in the corner.
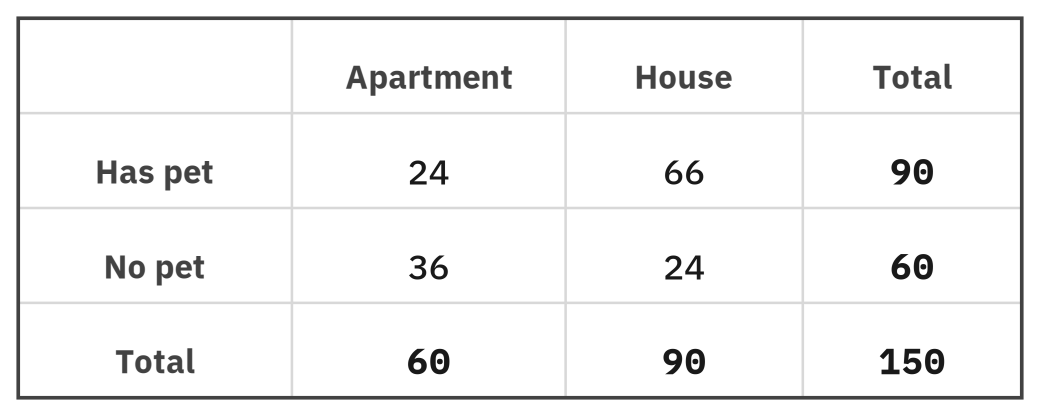
FIGURE 1 A two-way table of 150 households by housing and pet ownership. Inner cells are joint counts; the margins are totals.
WORKED Read probabilities from the table
Using the 150 households above, with the grand total as the denominator:
A single characteristic: P(has pet) = 90/150 = 0.6, and by the complement P(no pet) = 1 - 0.6 = 0.4.
Both at once (joint): P(apartment and has pet) = 24/150 = 0.16: straight from the inner cell.
A margin: P(apartment) = 60/150 = 0.4, using the column total.
Each of these divides by the grand total 150, because the chosen household could be anyone in the table.
▸ Compute conditional probability using the conditioned group as the sample space
Now the central idea. A conditional probability asks for the chance of one event given that another is already known to be true, and that knowledge changes the question by shrinking the group you are choosing from. “Given that the household lives in an apartment” means you are no longer choosing from all 150; you are choosing only from the 60 apartment households. The condition becomes the new denominator.
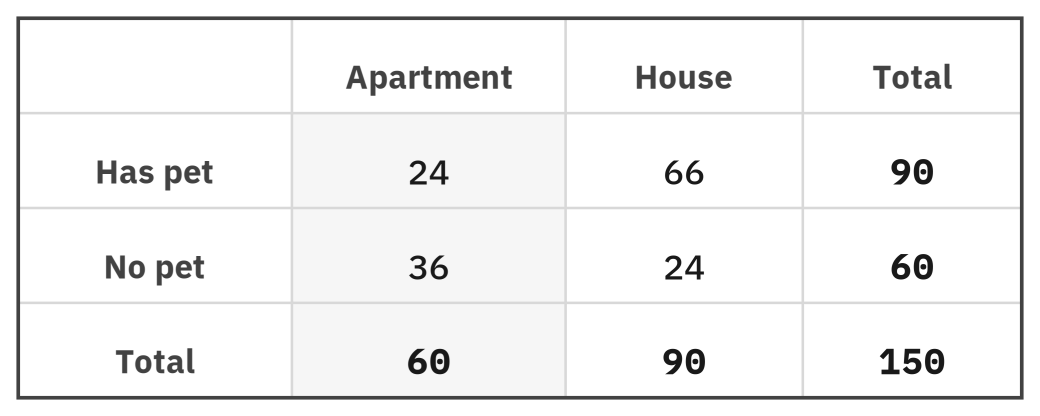
FIGURE 2 “Given the household is in an apartment” restricts attention to the apartment column: the denominator becomes 60, not 150.
WORKED Compute a conditional probability
P(has pet given apartment): restrict to the apartment column (total 60), then count pet owners within it (24):
P(has pet | apartment) = 24 / 60 = 0.4.
Reverse the condition and the denominator changes entirely. P(apartment given has pet) restricts to the pet-owner row (total 90):
P(apartment | has pet) = 24 / 90 = 0.267.
Same joint cell of 24, two different answers, because the condition picks the denominator, and the two conditions name different groups.
That last point is the one the test rewards most: P(A given B) and P(B given A) are not the same, because they divide the same overlap by different totals. Whenever you see “given,” find the group it names, make that total your denominator, and count the favorable cases inside it.
▸ Apply intersection, union, and complement probability rules
Two more rules round out the toolkit. For the probability of A or B, adding P(A) and P(B) double-counts the overlap, so you subtract it back: P(A or B) = P(A) + P(B) - P(A and B). And for independent events, where one outcome does not affect the other, the probability of both is the product P(A) × P(B), which paired with the complement handles “at least one” questions cleanly.
WORKED Use the or-rule and the complement
P(apartment or has pet), from the household table:
60/150 + 90/150 - 24/150 = 126/150 = 0.84.
Subtracting the overlap 24 prevents counting the apartment pet-owners twice.
For “at least one,” use the complement: if each of three independent trials succeeds with probability 0.2, then
P(at least one) = 1 - (0.8)3 = 1 - 0.512 = 0.488.
Counting the one way nothing happens is far easier than counting all the ways something does.
▸ Compute geometric probability from area ratios
Not every probability question counts discrete outcomes from a table. When an outcome is chosen uniformly from a continuous region, a point landing anywhere in a square with equal likelihood, say, probability is read as a ratio of areas instead of a ratio of counts: the area of the favorable region over the area of the whole sample space.
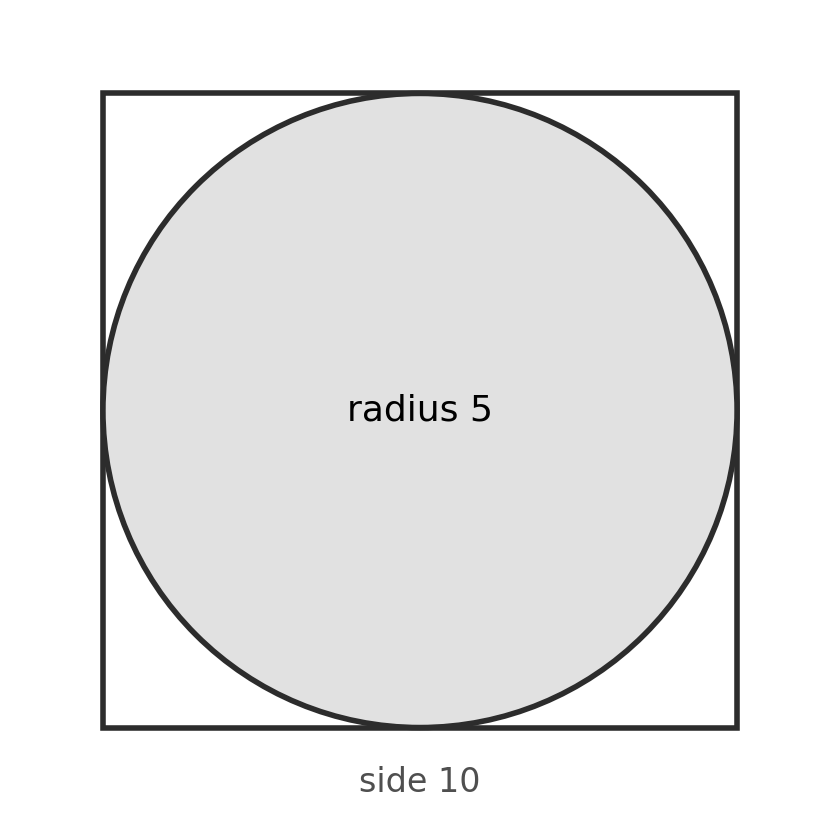
FIGURE 3 A point chosen uniformly in the square is equally likely to land anywhere in it; the circle marks the favorable region.
WORKED Geometric probability from a circle in a square
A point is chosen uniformly at random from a square of side 10. A circle of radius 5 lies entirely inside the square, as shown. What is the probability the point lands inside the circle?
Probability is the favorable area over the total area:
P = (area of circle) / (area of square) = 25π / 100 = π/4
The count-based formula, favorable outcomes over total outcomes, still applies; area simply plays the role that a count of discrete outcomes played in a two-way table. Using the circumference or the radius alone in place of area is the usual error.
The same area logic extends to two overlapping events at once, drawn as regions inside a rectangle representing the whole sample space. Reading it is the same denominator discipline as a two-way table, only drawn geometrically instead of counted in cells.
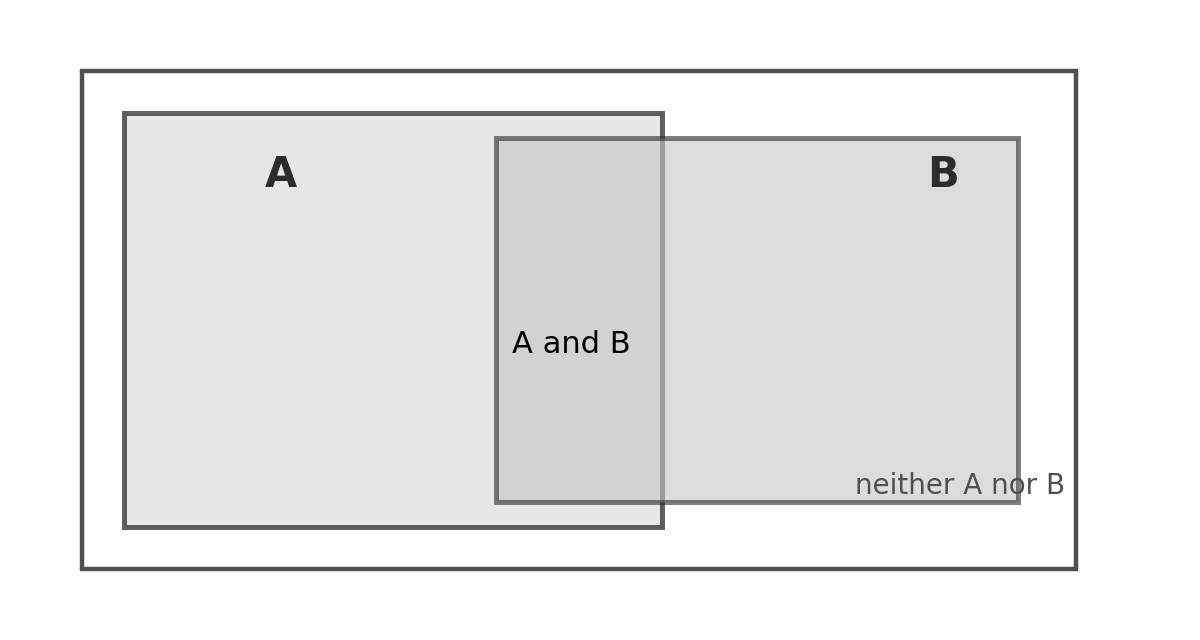
FIGURE 4 An area model: the whole rectangle is the sample space; overlapping regions represent events A and B happening together.
WORKED Read a conditional probability from an area model
The rectangle above has a total area of 120. Region A covers 50, region B covers 60, and their overlap covers 20. What is P(A and B)? What is P(A given B)?
P(A and B) is the overlap over the whole space:
P(A and B) = 20/120 = 1/6
P(A given B) restricts attention to region B alone, exactly as “given” restricted a two-way table to one column:
P(A | B) = 20/60 = 1/3
The whole area, 120, is the denominator only for an unconditional probability; the moment a condition is named, the denominator shrinks to that condition's own region, the same rule two-way tables already taught.
▸ Practice: probability
Practice items 1 through 7 and 9 through 14 refer to the commuter survey below; item 8 stands alone.
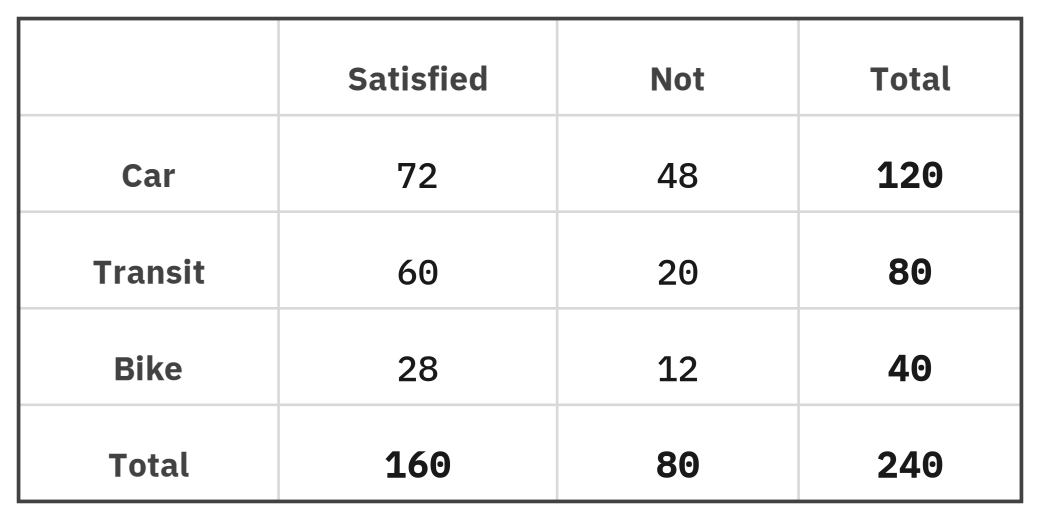
FIGURE 5 Survey of 240 commuters by mode of travel and satisfaction. “Not” means not satisfied.
1. What is the probability that a randomly selected transit commuter is satisfied? (grid-in)
2. Given that a commuter is satisfied, what is the probability that the commuter travels by car? (grid-in)
Question 3
- A. they are equal
- B. a transit commuter is satisfied
- C. a satisfied commuter uses transit
- D. cannot be determined
4. What is the probability that a randomly selected commuter travels by car or is satisfied? (grid-in, as a fraction or decimal)
5. Given that a commuter is not satisfied, what is the probability that the commuter uses transit? (grid-in)
6. Given that a commuter does not travel by car, what is the probability that the commuter is satisfied? (grid-in, as a fraction or decimal)
7. If 720 commuters were surveyed in the same proportions, how many satisfied transit users would be expected? (grid-in)
Question 8
- A. 0.488
- B. 0.6
- C. 0.512
- D. 0.008
9. What fraction of all surveyed commuters are bike users who are satisfied? (grid-in)
10. Of the satisfied commuters, what fraction do not travel by car? (grid-in, as a fraction or decimal)
Question 11
- A. yes, because the counts are equal
- B. no, because P(satisfied | transit) ≠ P(satisfied)
- C. yes, because both exceed one half
- D. cannot be determined
Question 12
- A. 1/3
- B. 4/9
- C. 2/3
- D. 1/9
13. In a separate random sample of 300 commuters with the same satisfaction rate, how many would be expected to be not satisfied? (grid-in)
14. What is the probability that a satisfied commuter uses transit? (grid-in)
15. In a survey of 200 people, the probability that a randomly selected person prefers tea is 0.35. Of the people who prefer tea, 40 percent also prefer decaf. How many people surveyed prefer both tea and decaf? (grid-in)
▸ Solutions: probability
1: 0.75. Restrict to transit commuters (total 80) and count those satisfied (60): 60/80 = 0.75. The condition “transit” makes 80 the denominator, not 240.
2: 0.45. Restrict to satisfied commuters (total 160) and count car users (72): 72/160 = 0.45. This reverses the previous condition, so the denominator changes to 160.
Show the answers and explanations
3: B. The first is 60/80 = 0.75; the second is 60/160 = 0.375. They share the cell 60 but divide by different totals, so the transit-commuter-satisfied probability is larger.
4: 13/15. Use the or-rule: P(car) + P(satisfied) - P(car and satisfied) = 120/240 + 160/240 - 72/240 = 208/240 = 13/15, or about 0.867. Subtracting the 72 overlap avoids double-counting.
5: 0.25. Restrict to the not-satisfied commuters (total 80) and count transit users (20): 20/80 = 0.25.
6: 11/15. Not-car commuters are transit and bike: 80 + 40 = 120. Among them, satisfied are 60 + 28 = 88, so 88/120 = 11/15, or about 0.733.
7: 180. The satisfied-transit share is 60/240 = 1/4 of all commuters; scaling to 720 gives 720 × (60/240) = 180.
Show the answers and explanations
8: A. Use the complement: the chance of no trigger in one attempt is 0.8, so in three independent attempts it is (0.8)3 = 0.512. At least one is 1 - 0.512 = 0.488.
9: 7/60. This is a joint probability over the grand total: 28/240 = 7/60, or about 0.117.
10: 11/20. Among the 160 satisfied commuters, the non-car ones are 60 + 28 = 88, so 88/160 = 11/20 = 0.55.
Show the answers and explanations
11: B. Independence would require P(satisfied | transit) = P(satisfied). But 60/80 = 0.75 while 160/240 = 0.667, and these differ, so the events are not independent.
12: B. Each commuter is satisfied with probability 160/240 = 2/3. For two independent selections, multiply: (2/3)(2/3) = 4/9.
13: 100. The not-satisfied rate is 80/240 = 1/3; in 300 commuters that is 300 × (1/3) = 100.
14: 0.375. Restrict to the 160 satisfied commuters and count transit users (60): 60/160 = 0.375 = 3/8.
15: 28. The probability of tea sets the count first: 0.35 × 200 = 70 people prefer tea. The 40 percent figure is conditional on that group, not the whole 200, so it applies to the 70, not to 200 directly: 0.40 × 70 = 28. Applying 40 percent to the full 200 instead of the 70 tea drinkers is the requested-object error this item is built to catch.
▸ Probability: chapter summary
Probability is favorable outcomes over total outcomes, a proportion between 0 and 1, and a two-way table turns counts into probabilities by your choice of denominator. An unconditional probability divides by the grand total; a joint probability reads a single inner cell over that total; a conditional probability, signaled by “given”, shrinks the denominator to just the named group. Reverse the condition and the answer changes, because P(A given B) and P(B given A) divide the same overlap by different totals. Add the or-rule, the complement for “at least one,” and the product for independent events, and these rules cover the probability structures practiced in this chapter.