Linear functions: rate of change and initial value
In a real situation a line says two things: how fast something changes, and where it began. Almost every linear word problem is asking you to name one of those two.
A linear function is the line from the last lesson, now carrying meaning. The algebra has not changed at all; what changes is that the numbers mean something (a cost, a distance, a temperature, a count) and the test mostly asks you to translate between the equation and the situation rather than to compute anything. Once you can name what each number stands for, the arithmetic that remains is small. So this lesson is almost entirely about reading: turning a slope into a rate, an intercept into a starting value, and a description into a model you can read back.
Interpret rate of change and initial value in a linear function
Every linear model carries exactly two pieces of meaning, and they map directly onto the two features you already know. The slope is a rate of change: how much the output moves for each one-unit step in the input. The intercept is a starting value, the output at the moment the input is zero. Almost every interpretation question is asking you to attach one of those two meanings to one of the two numbers.
Worked: a cost model,
Here is the cost of an order in dollars and is the number of items. Read each number as a meaning.
The 30 is the cost when : a fixed charge that exists before a single item is added, such as a setup or delivery fee. It is the starting value.
The 11 is the rate: each additional item adds eleven dollars. It is the slope, and it describes change, not a fixed amount.
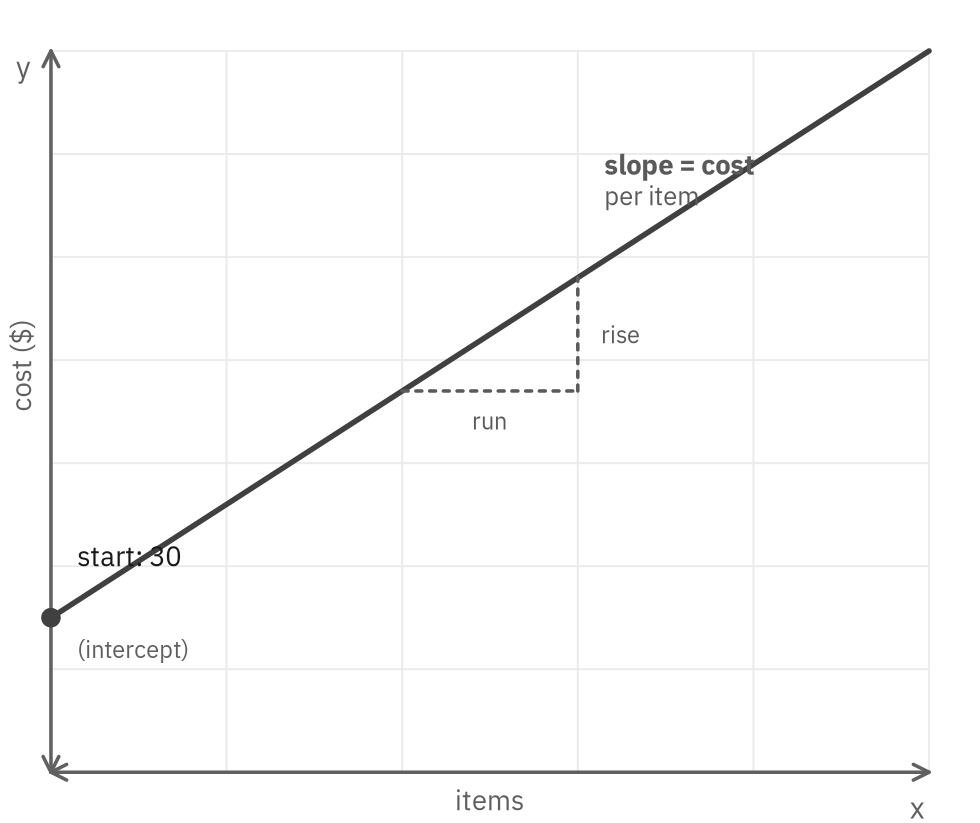
Figure 1. In a cost model the intercept is the fixed starting charge; the slope is the cost added per item.
So when a question asks what some number in a model represents, you are not being asked to calculate. You are being asked to decide whether that number is the rate or the start, and to say so in the language of the situation. That single decision answers the whole question.
A harder version attaches a condition to only one of the two pieces, and reading exactly which piece it touches is the graded difficulty.
Worked: a charge that taxes only part of the bill
A service charges a one-time setup fee of $42 and $18 per month. The monthly charge is taxed at 5 percent, but the setup fee is not. Which expression gives the total cost after months?
The 42 is a fixed fee, untouched by the tax; the 18 is the rate, and tax applies only to the amount it generates.
The temptation is to tax the whole expression, , which quietly taxes a fee the situation never subjects to tax. Reading exactly which term a condition modifies, not just that a condition exists, is what separates this from the basic version.
Use units to interpret slope and initial value
The most reliable way to keep a rate and a starting value from getting confused is to attach units, because a rate and a starting value usually carry different units. A starting value carries the plain units of the output. A rate carries the output's units per one unit of the input: dollars per item, gallons per minute, miles per hour. Naming the units out loud usually settles which number is which before any thinking is required.
Worked: naming the units
In , where is distance in miles and is time in hours:
the intercept 3 is measured in miles, a head start already travelled at ;
the slope 55 is measured in miles per hour, the speed. Only one of the two can be a speed, and its units say so.
This is also why the wrong answer to an interpretation question is so often the other feature, stated correctly. A model has only two numbers to talk about, and the tempting choice usually describes the one you were not asked for. Reading the units of the requested number first keeps you on the right one.
Solve a linear model for input or output
Once a model is in hand, the test asks you to read it in two directions. Forward is a prediction: put in an input, get out an output. Backward is the reverse: you are told the output and asked for the input that produces it. The backward direction is where careful reading matters most, because it is easy to answer the forward question by reflex when the backward one was asked.
Worked: a draining tank,
is volume in gallons, is time in minutes.
Forward: the volume after 30 minutes: gallons.
Backward: the time when only 1500 gallons remain: set , so , giving and minutes.
Same model, two opposite readings. The forward one substitutes; the backward one solves.
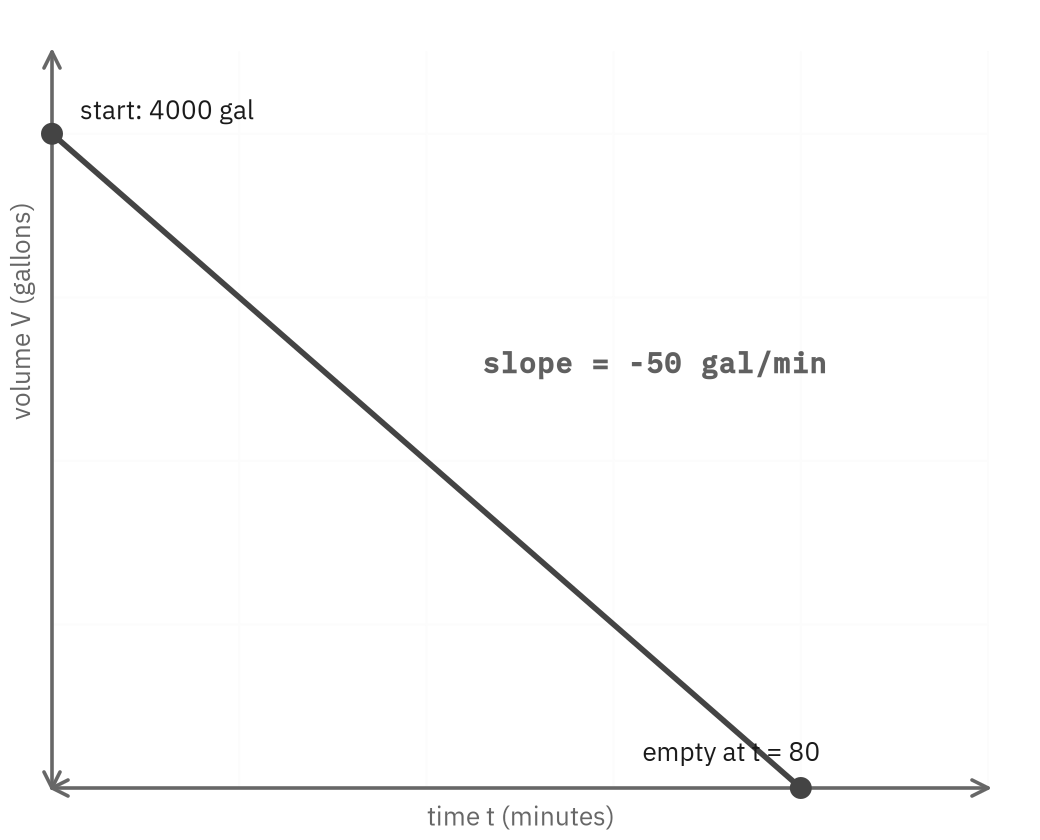
Figure 2. Forward reading predicts a volume from a time; backward reading solves for the time that gives a volume.
Before you compute, settle which direction the question wants and which object it asks for: a time or a volume, an input or an output. This is the requested-object care you practice throughout the course, applied to a word problem. The value you found is only an answer if it is the value that was asked for.
Distinguish interpolation from extrapolation in linear models
A linear model is a description of a situation, and it is believable only over the range where the situation actually behaves linearly. Read literally, the algebra will happily produce values far outside that range, and they are nonsense. Part of high-level care is knowing where a model is meant to apply and refusing to follow it past the edge. Estimating inside the range of the data is interpolation; estimating beyond it is extrapolation, and it deserves suspicion.
Worked: the edge of the tank model
falls to zero when , that is at minutes.
For beyond 80 the formula returns a negative volume, which no tank can hold. The model is trustworthy only for ; past that edge it has stopped describing anything real.
The starting value deserves the same scrutiny. Sometimes the input zero is a real moment the intercept genuinely describes, the tank at the instant draining begins. Other times zero sits outside the believable range, and the intercept is only a mathematical artifact of extending the line back to an axis it never really reaches. The question usually tells you which; your job is to notice.
Compute average rate of change from two points
A preview: the worked example below uses a nonlinear function on purpose, since that is where average rate of change actually earns its name. The skill itself belongs to Advanced Math's nonlinear functions, previewed here because the formula is easy to state now and worth having in hand before that unit arrives.
"Rate of change" and "slope" are the same idea, and for a linear model that rate is constant; it is the slope, everywhere, over every interval. The phrase becomes worth pausing on only when a function is not linear, because then the rate genuinely varies, and the test asks for the average rate of change across a stated interval. That average is just the slope of the straight line joining the two endpoints: the change in output over the change in input.
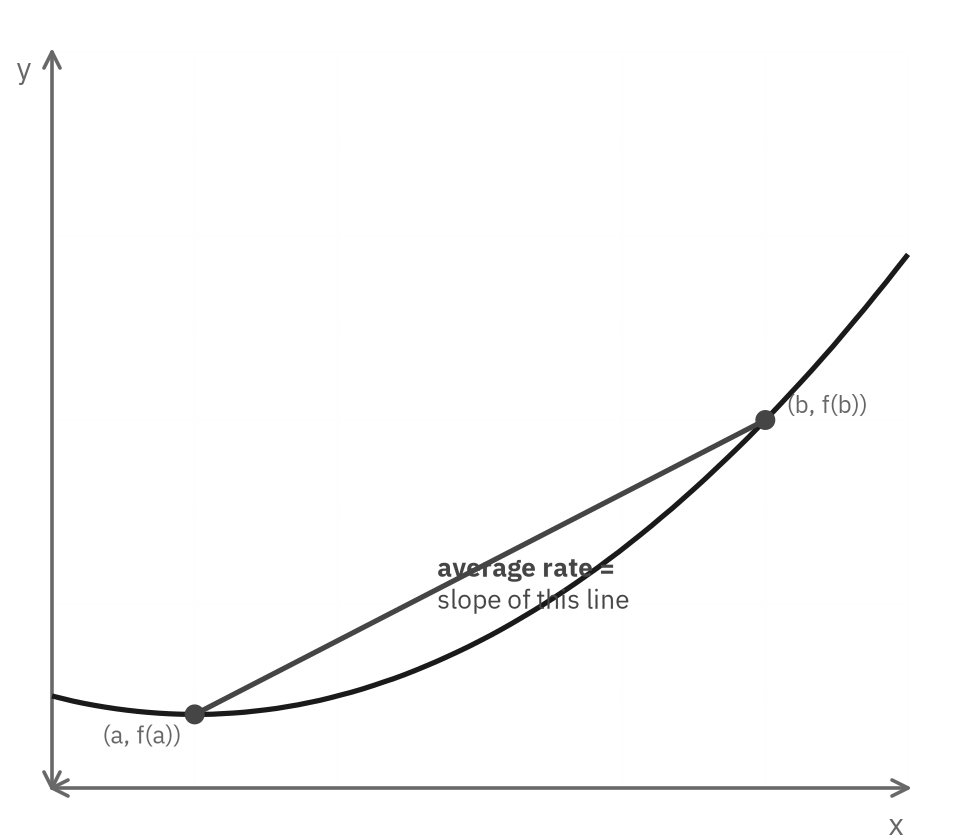
Figure 3. Average rate of change over an interval is the slope of the line through the two endpoints, even when the curve between them bends.
Worked: average rate from a table
A function has , , and : values that curve upward, so the function is not linear.
Its average rate of change over is still a single slope between the endpoints:
Note what this is not: it is not the rate at any one input, and not a value of the function. It is the overall climb across the interval, spread evenly.
Create a linear function from a verbal description
The reverse skill, turning a sentence into a model, is the same translation run backward, and it comes down to one sorting task: separate the part that is fixed from the part that happens per unit. The fixed part is the intercept; the per-unit part is the slope; the thing the per-unit part is counted against is the input variable.
Worked: a service charge
"A technician charges a flat fee of $45 plus $60 for each hour of work."
The flat fee is fixed, attached to nothing that varies: the intercept, 45. The 60 is attached to each hour, the rate. Letting be hours of work:
Worked: a subscription
"A service costs $12 a month plus $2 for each additional screen."
Fixed monthly cost is the intercept; the per-screen charge is the rate. Letting be the number of additional screens:
The hardest part is rarely the algebra; it is defining the variable precisely. "Additional screens" is not the same as "screens," and a careful definition keeps the model honest.
Create and interpret linear functions from tables and graphs
A model does not always arrive as an equation. Often it is a table or a graph, and the same two features are waiting to be read. From a table, the rate is the change in output for each step in input, and the starting value is the output when the input is zero: read directly if the table reaches zero, or recovered by stepping backward.
Worked: from a table to a model
A monthly cost is recorded as the months pass:
Monthly cost over time (months) 0 1 2 3 Cost (dollars) 50 65 80 95 Each one-month step raises the cost by 15, so the rate is $15 per month. At the cost is 50, the starting value. The model is therefore:
From a graph the reading is the same (slope for the rate, intercept for the start); only now you read them off the axes in the situation's own units.
Compare rates and initial values across linear models
When two linear models describe competing situations (two plans, two routes, two rates) the comparison is, once again, a comparison of the two features. The one with the larger slope grows faster; the one with the larger intercept starts higher. Those two facts together tell you the whole story of how the models relate as the input grows.
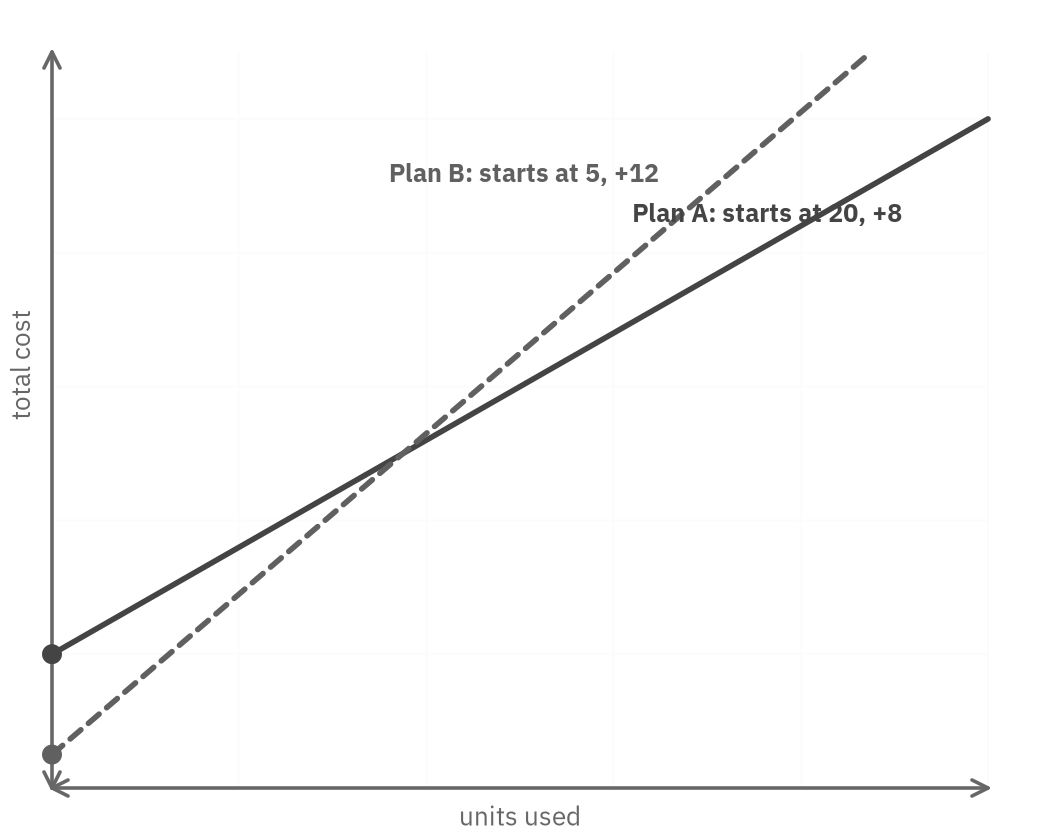
Figure 4. Two plans: the higher intercept starts ahead; the steeper slope eventually overtakes it.
Worked: two plans
Plan A: . Plan B: .
Plan A starts higher: its intercept 20 exceeds Plan B's 5, so for small it costs more.
Plan B grows faster: its slope 12 exceeds 8, so as increases, B's cost climbs more steeply and eventually overtakes A.
There is a single input where the two are equal, after which B is the larger. Finding that exact crossing point is a system of equations, which is the work of the next unit; here it is enough to read which grows faster and which starts higher.
Hand, Desmos, or hybrid: if the exact crossing point itself is what a question wants, graphing both models as lines and clicking their intersection reads off both the input and output at once, often faster than setting up and solving the system algebraically.
Chapter summary
A linear model holds a rate and a starting value, and almost every question about one is asking you to translate: to say which number is the rate and which is the start, in the right units, and to read the model forward to a prediction or backward to an input. The arithmetic is rarely the difficulty. Naming the meaning, respecting the units, and refusing to trust the model past the edge of the situation it describes: that is how a line is read in the world.