Welcome to Problem-Solving and Data Analysis
The third domain trades abstract relationships for measured ones. Where Algebra and Advanced Math worked with and as pure quantities, Problem-Solving and Data Analysis works with the numbers the world actually hands you: ratios and rates, percentages, and data laid out in tables, bar graphs, and scatterplots. It is a smaller share of the Math section than Algebra or Advanced Math. Its questions often use modest computation but demand precise interpretation of units, graphs, samples, and statistical claims.
A question here rarely asks you to do something difficult; it asks you to read something precisely: to notice the units, to read the right axis, to see whether a graph covers the range you are reasoning about, and, increasingly, to judge what a set of data is actually allowed to tell you. Most mistakes in this domain are reading mistakes that look like math mistakes. Slowing down by a few seconds at the right moment is worth more than raw speed.
Two habits carry almost all of it. The first is proportional reasoning. Ratios, rates, percentages, and probabilities are, underneath, the same idea (a part compared to a whole, or one quantity compared to another), and the same scaling logic answers them all. The second is disciplined reading of representations. A table, a bar graph, and a scatterplot each store quantities in a particular way, and knowing how to extract a number from each, cleanly and without assuming more than is shown, is half the battle.
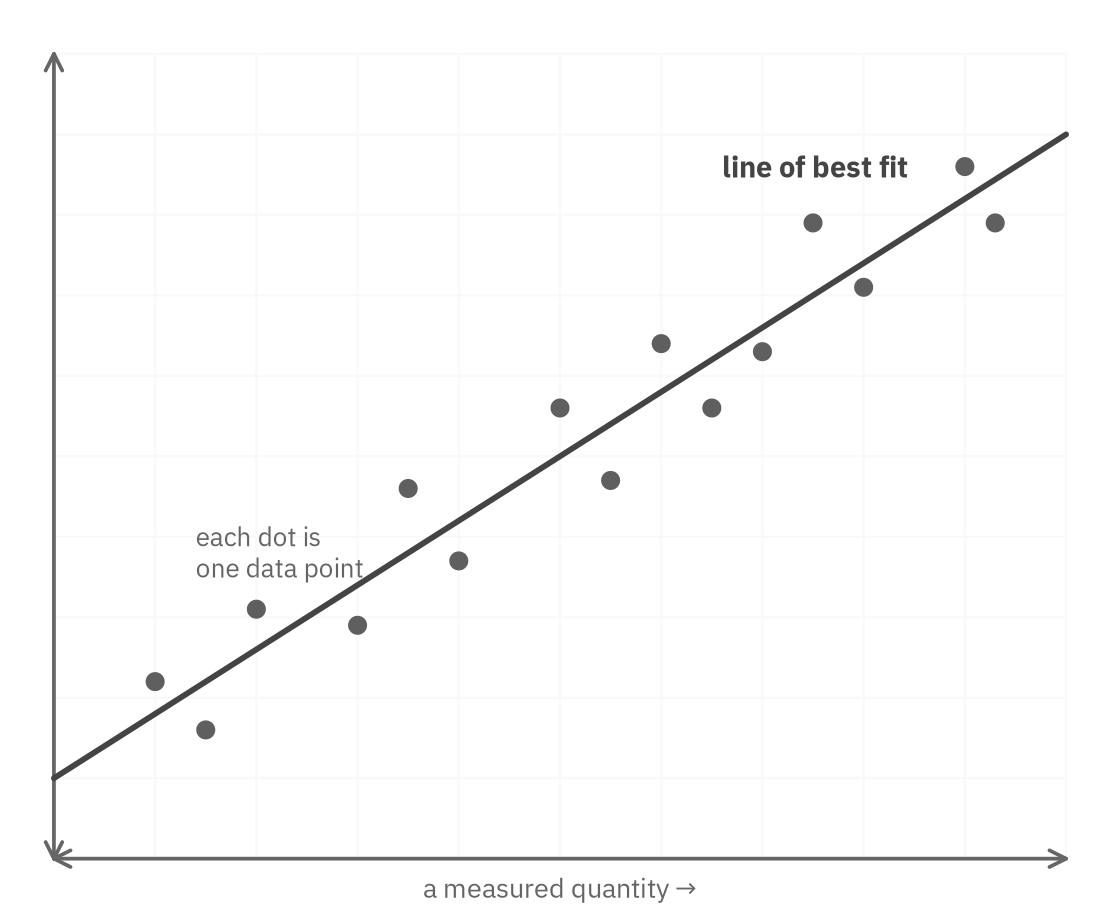
Figure 1. The recurring image of the domain: a cloud of measurements, summarized by a line that captures the trend without passing through every point.
The scatterplot above is the domain's signature object: a set of real measurements, each a single dot, with a line drawn to capture their overall trend. The line summarizes the data without claiming to pass through every point, and reasoning about it means knowing the difference between the trend and the scatter, between what the data shows and what it merely suggests.
So the questions to carry through this domain are reading questions as much as math questions. What quantity is being compared to what, and in what units? What does this graph actually show, and over what range? And, a question that becomes central by the end of the domain, what may I legitimately conclude from this data, and where would a confident-sounding claim be reaching past the evidence?
In this domain
- Ratios, rates, proportional relationships, and units: proportional reasoning, unit rates, and converting between units while keeping track of what cancels.
- Percentages: percent of, percent change, and working backward from a final amount to the original.
- One-variable data: center and spread, the shape of a distribution, and what an outlier does to each measure.
- Two-variable data: scatterplots, lines and curves of best fit, and reading a model's slope and intercept in context.
- Probability and conditional probability: likelihood as a proportion, two-way tables, and conditional probability.
- Inference, margin of error, and statistical claims: what a sample says about a population, margin of error, and which conclusions an observational study or an experiment can actually support.
The mathematics in this domain is gentler than what came before, but the reading is sharper. Attend to the units, read the axis that is actually labeled, and ask of every statistic what it truly claims before you trust it, and these questions reward your care more reliably than almost any others on the test. We begin where all of this begins, with the ratio, the simplest comparison of one quantity to another.
Ratios, rates, proportional relationships, and units
A ratio is the simplest comparison there is, one quantity measured against another. Master the scaling that keeps a ratio fixed, and a surprising share of this domain is already yours.
Much of this domain begins with comparing one quantity with another through ratios, rates, or proportions. A ratio is that comparison, and the reasoning built on it (proportions, rates, unit conversions, even the percentages and probabilities of later units) is all the same move performed in different settings. The core skill is scaling: changing the size of both quantities together so the comparison between them stays the same. Once that feels automatic, most of what this unit asks becomes a matter of setting it up correctly and reading the units with care.
Interpret ratios as multiplicative comparisons
A ratio compares two amounts by division, written or as the fraction . It can compare a part to another part, three blue marbles to four red ones, or a part to the whole, three blue marbles out of seven total. The first thing to settle on any ratio problem is which of those two comparisons you are being handed, because the same numbers mean different things in each.
A ratio stays the same when you multiply or divide both quantities by the same number; this produces equivalent ratios. So , , and are all the same comparison at different scales, exactly as , , and are the same fraction. Scaling both parts together is the one operation that leaves a ratio unchanged, and it is the engine of nearly everything that follows.
Solve proportional relationships with equivalent ratios
A proportion is a statement that two ratios are equal, and most ratio questions are really proportions with one quantity left blank. There are two reliable ways to solve one. When the scale factor is easy to see, scale directly; when it is not, cross-multiply and solve.
Worked example: solve
By scaling: the bottom went from to , a factor of , so the top scales the same way: .
By cross-multiplying: set the cross-products equal and solve: , so .
Both routes give ; the first is faster when the factor is clean, the second when it is not.
Interpret rates and unit rates
A rate is a ratio whose two quantities have different units: miles and hours, dollars and pounds, words and minutes. The most useful form of a rate is the unit rate, the amount per one of the second quantity, found by dividing so the second number becomes one.
Worked example: find the unit rate
A car travels miles in hours. Divide to get miles per one hour: miles per hour.
A bag of apples costs $9, so the unit price is dollars per apple.
Once you have the rate per one, scaling to any other amount is a single multiplication.
Convert units with dimensional analysis
Changing from one unit to another is where care pays off, and there is a method that makes it almost foolproof: multiply by a conversion factor (a fraction equal to one, such as ) arranged so the unit you want to remove cancels. Treat units like algebraic factors: a unit on top cancels the same unit on the bottom, and you keep multiplying by factors until only the unit you want is left.
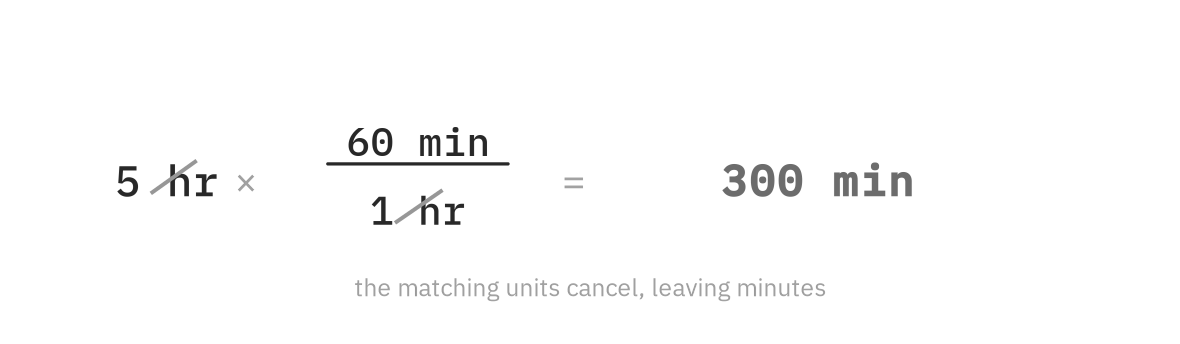
Figure 2. Multiply by a conversion factor arranged so the unwanted unit cancels, leaving only the unit you want.
Worked example: convert with cancellation
Convert hours to minutes. Multiply by the factor with hours on the bottom so hours cancel: minutes.
Rates convert the same way. To turn miles per hour into miles per minute, multiply by hour over minutes: mile per minute.
Convert squared, cubed, and compound units
Two variations on unit conversion trip up an otherwise reliable method. The first is converting an area or a volume: since area carries two length dimensions, its conversion factor must be squared, not used as-is.
Worked example: convert a squared unit
If mile kilometers, one square mile equals how many square kilometers?
Area scales by the square of the linear factor, since a square mile is a mile times a mile: .
Using directly, without squaring it, is the standard trap; a linear conversion factor never carries over unchanged to an area or a volume. For a volume, the factor is cubed.
The second variation chains two conversions at once, changing both the distance unit and the time unit in the same problem. The cancellation method handles this without any new idea: multiply by as many factors as it takes, as long as each one equals one and the unwanted units cancel in sequence.
Worked example: chain two conversions together
Convert miles per hour to feet per second, using feet mile.
Chain a distance conversion and a time conversion, letting the unwanted units cancel in turn: ft/s.
Each factor is exactly one, so multiplying by them changes only the units, never the underlying rate. Handling both conversions in one chained product avoids the rounding drift that redoing the problem in two separate steps can introduce.
Rates that combine a count with an area, like population density, use the same cancellation logic once the rate is recognized as a ratio: people per square kilometer, multiplied by an area in square kilometers, leaves people.
Worked example: use a density rate
A region has a population density of people per square kilometer and an area of square kilometers. What is its population?
Multiply the density by the area, letting the square-kilometer units cancel: people.
Dividing instead of multiplying is the common reversal; density already carries the per-area units, so the area is multiplied in, not divided out.
The same multiplication builds a new unit rather than cancelling down to a familiar one. Power used over time is energy, and a device rated at kilowatts run for hours uses kilowatt-hours. The kilowatt-hour is a product of the two given units, not a conversion between them; nothing cancels, because nothing needs to.
Identify and model proportional relationships
When two quantities keep a constant ratio (double one and the other doubles, triple it and the other triples) they are proportional, and the relationship is written . The number is the constant of proportionality, and it is just the unchanging ratio . Graphed, a proportional relationship is always a straight line through the origin, because zero of one quantity means zero of the other.
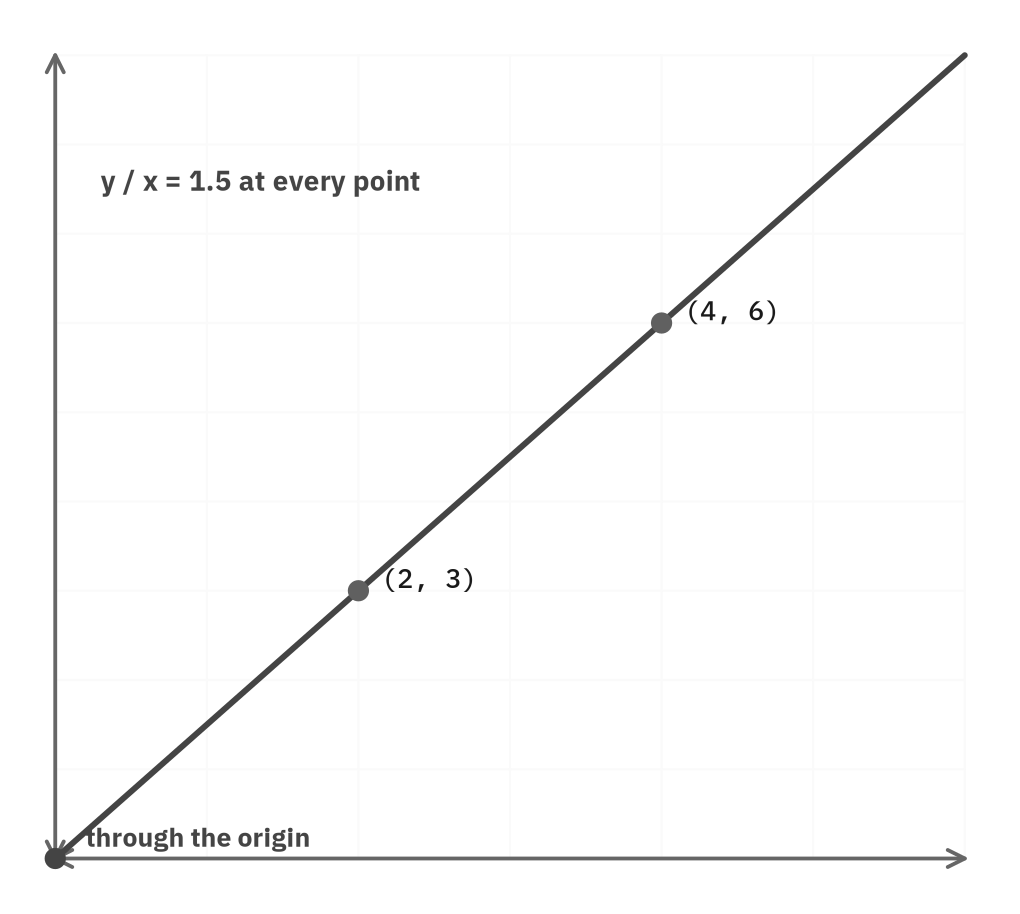
Figure 3. A proportional relationship is a line through the origin; the ratio is the same constant at every point.
Worked example: use a proportional relationship
is proportional to , and when . Find the constant, then use it.
, so . When : .
This is the same line you met in Algebra, with the special feature that it passes through the origin, which is exactly what "proportional" adds to "linear."
That last distinction matters: every proportional relationship is linear, but not every linear relationship is proportional. A line with a -intercept other than zero, like , is linear but not proportional, because the ratio changes from point to point. Proportionality is the stricter condition: constant ratio, line through the origin.
Distinguish part-to-part from part-to-whole ratios
When a ratio compares parts that make up a whole, a parts picture is often the fastest route. Add the numbers in the ratio to get the total number of equal parts, find the size of one part by dividing the total amount by that number, then scale each part up.
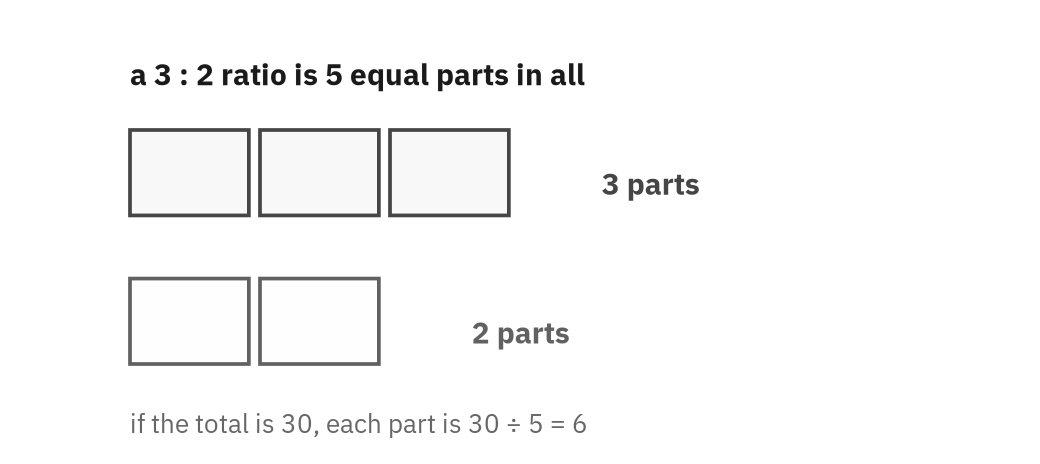
Figure 4. A ratio divides the whole into equal parts. Find one part, then scale each share.
Worked example: split by a ratio
Blue and red marbles are in the ratio , and there are marbles in all. How many are blue?
The ratio has equal parts, so each part is marbles. Blue is parts, , and red is parts, .
The check is that the parts sum to the whole: .
Solve contextual ratio and rate problems
These few moves cover a wide range of everyday situations, all solved by the same scaling. A recipe is a ratio: if cookies need cups of flour, then cookies need cups, scaling the flour by the same factor as the cookies. A map is a ratio: at a scale of inch to miles, four inches represents miles. A mixture is a ratio: a drink mixed parts water to parts juice is juice, so liters of it holds liters of juice. In every case you are scaling a fixed comparison up or down, and naming the units keeps you honest about what each number counts.
A checklist for ratio and rate questions
- Name the two quantities and their units before you touch a number.
- Decide whether the ratio is part-to-part or part-to-whole.
- Find the unit rate or the scale factor, whichever is cleaner.
- Write conversions as fractions that cancel the unwanted unit; square or cube the factor for area and volume.
- Sanity check: if you scaled up, the answer should be larger. If your answer moved the wrong way, you inverted a ratio.
Summary. A ratio compares two quantities, and it holds steady only when you scale both together: that single fact powers proportions, rates, unit conversions, and parts reasoning alike. Solve a proportion by scaling or cross-multiplying; reduce a rate to its value per one; convert units by multiplying so the unwanted ones cancel; and split a whole by counting the parts. Proportional relationships, , are the lines through the origin where the ratio never changes. Track the units and identify whether the ratio is part-to-part or part-to-whole before scaling.